Banana mild mosaic virus
Taxonomy: Viruses; Riboviria; Orthornavirae; Kitrinoviricota; Alsuviricetes; Tymovirales; Betaflexiviridae; Quinvirinae
Average proteome isoelectric point is 6.83
Get precalculated fractions of proteins

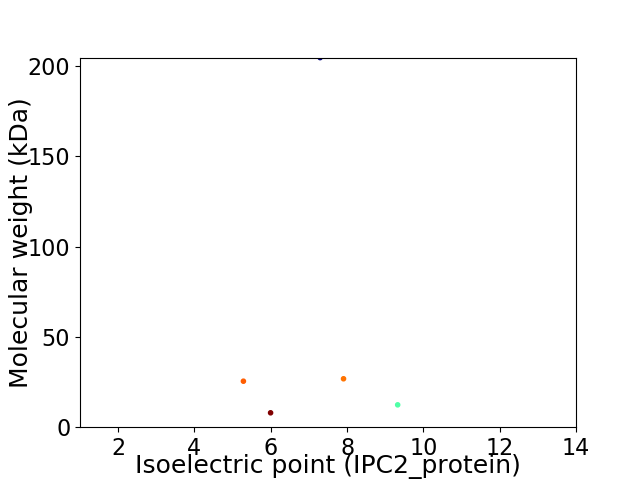
Virtual 2D-PAGE plot for 5 proteins (isoelectric point calculated using IPC2_protein)
Get csv file with sequences according to given criteria:
* You can choose from 21 different methods for calculating isoelectric point
Summary statistics related to proteome-wise predictions


Protein with the lowest isoelectric point:
>tr|Q993S7|Q993S7_9VIRU Helicase OS=Banana mild mosaic virus OX=148879 PE=3 SV=1
MM1 pKa = 7.43NSSLEE6 pKa = 3.93NLKK9 pKa = 10.2QLIEE13 pKa = 4.26NFGFTATGNPVTDD26 pKa = 4.43KK27 pKa = 11.06IVIHH31 pKa = 6.38GVAGCGKK38 pKa = 8.61STLTKK43 pKa = 10.61EE44 pKa = 4.05LLKK47 pKa = 11.07DD48 pKa = 3.47NNFNIVNALSKK59 pKa = 11.03EE60 pKa = 4.1DD61 pKa = 4.05FDD63 pKa = 5.05ITGQYY68 pKa = 8.88IKK70 pKa = 10.97KK71 pKa = 9.82EE72 pKa = 4.07LTTSDD77 pKa = 3.15SKK79 pKa = 11.61INVLDD84 pKa = 4.28EE85 pKa = 4.17YY86 pKa = 11.44LSVDD90 pKa = 3.46CHH92 pKa = 7.85KK93 pKa = 11.02GFQVLLADD101 pKa = 4.36PFQYY105 pKa = 10.18KK106 pKa = 10.07GKK108 pKa = 9.37PYY110 pKa = 9.93LANYY114 pKa = 8.72IKK116 pKa = 10.62KK117 pKa = 10.0KK118 pKa = 6.85SHH120 pKa = 6.02RR121 pKa = 11.84FKK123 pKa = 11.21KK124 pKa = 10.13EE125 pKa = 3.38LVPILLEE132 pKa = 4.18LGVEE136 pKa = 4.26VEE138 pKa = 4.3VEE140 pKa = 4.07EE141 pKa = 4.54EE142 pKa = 3.97GLNIIRR148 pKa = 11.84GSAYY152 pKa = 9.93EE153 pKa = 4.27IEE155 pKa = 4.55PKK157 pKa = 10.76GKK159 pKa = 9.5IISVEE164 pKa = 4.1EE165 pKa = 3.93EE166 pKa = 3.93VVKK169 pKa = 10.82YY170 pKa = 10.76VSEE173 pKa = 4.52HH174 pKa = 5.7GLEE177 pKa = 3.58IHH179 pKa = 6.45YY180 pKa = 8.17PSCIQGQEE188 pKa = 3.68FDD190 pKa = 3.88VVTFYY195 pKa = 11.13HH196 pKa = 6.92KK197 pKa = 10.68EE198 pKa = 3.82DD199 pKa = 3.51LRR201 pKa = 11.84ALDD204 pKa = 3.74RR205 pKa = 11.84SDD207 pKa = 4.3VYY209 pKa = 11.36VALTRR214 pKa = 11.84VRR216 pKa = 11.84EE217 pKa = 4.02EE218 pKa = 4.32LRR220 pKa = 11.84LLQLL224 pKa = 3.97
MM1 pKa = 7.43NSSLEE6 pKa = 3.93NLKK9 pKa = 10.2QLIEE13 pKa = 4.26NFGFTATGNPVTDD26 pKa = 4.43KK27 pKa = 11.06IVIHH31 pKa = 6.38GVAGCGKK38 pKa = 8.61STLTKK43 pKa = 10.61EE44 pKa = 4.05LLKK47 pKa = 11.07DD48 pKa = 3.47NNFNIVNALSKK59 pKa = 11.03EE60 pKa = 4.1DD61 pKa = 4.05FDD63 pKa = 5.05ITGQYY68 pKa = 8.88IKK70 pKa = 10.97KK71 pKa = 9.82EE72 pKa = 4.07LTTSDD77 pKa = 3.15SKK79 pKa = 11.61INVLDD84 pKa = 4.28EE85 pKa = 4.17YY86 pKa = 11.44LSVDD90 pKa = 3.46CHH92 pKa = 7.85KK93 pKa = 11.02GFQVLLADD101 pKa = 4.36PFQYY105 pKa = 10.18KK106 pKa = 10.07GKK108 pKa = 9.37PYY110 pKa = 9.93LANYY114 pKa = 8.72IKK116 pKa = 10.62KK117 pKa = 10.0KK118 pKa = 6.85SHH120 pKa = 6.02RR121 pKa = 11.84FKK123 pKa = 11.21KK124 pKa = 10.13EE125 pKa = 3.38LVPILLEE132 pKa = 4.18LGVEE136 pKa = 4.26VEE138 pKa = 4.3VEE140 pKa = 4.07EE141 pKa = 4.54EE142 pKa = 3.97GLNIIRR148 pKa = 11.84GSAYY152 pKa = 9.93EE153 pKa = 4.27IEE155 pKa = 4.55PKK157 pKa = 10.76GKK159 pKa = 9.5IISVEE164 pKa = 4.1EE165 pKa = 3.93EE166 pKa = 3.93VVKK169 pKa = 10.82YY170 pKa = 10.76VSEE173 pKa = 4.52HH174 pKa = 5.7GLEE177 pKa = 3.58IHH179 pKa = 6.45YY180 pKa = 8.17PSCIQGQEE188 pKa = 3.68FDD190 pKa = 3.88VVTFYY195 pKa = 11.13HH196 pKa = 6.92KK197 pKa = 10.68EE198 pKa = 3.82DD199 pKa = 3.51LRR201 pKa = 11.84ALDD204 pKa = 3.74RR205 pKa = 11.84SDD207 pKa = 4.3VYY209 pKa = 11.36VALTRR214 pKa = 11.84VRR216 pKa = 11.84EE217 pKa = 4.02EE218 pKa = 4.32LRR220 pKa = 11.84LLQLL224 pKa = 3.97
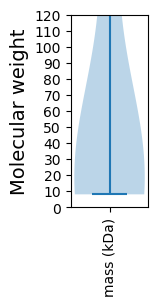
Molecular weight: 25.48 kDa
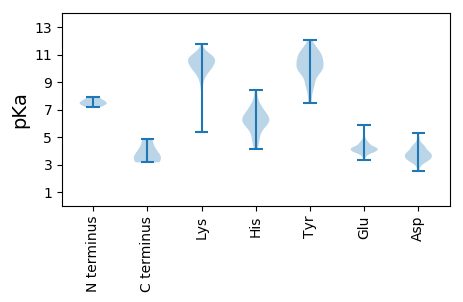
Isoelectric point according different methods:
Protein with the highest isoelectric point:
>tr|Q993S6|Q993S6_9VIRU Triple gene block protein 2 OS=Banana mild mosaic virus OX=148879 PE=4 SV=1
MM1 pKa = 7.45ALSRR5 pKa = 11.84PPDD8 pKa = 3.5YY9 pKa = 11.15TKK11 pKa = 11.13VLLVSSLAVGTAIIIHH27 pKa = 5.9FLRR30 pKa = 11.84RR31 pKa = 11.84SEE33 pKa = 4.23LPHH36 pKa = 8.19VGDD39 pKa = 4.38NLHH42 pKa = 6.51HH43 pKa = 6.56LPYY46 pKa = 10.5GGSYY50 pKa = 10.83CDD52 pKa = 3.24GTKK55 pKa = 10.25RR56 pKa = 11.84INYY59 pKa = 8.54GGSHH63 pKa = 6.36NKK65 pKa = 9.75HH66 pKa = 6.0SLITFNPLLLVFILSALIYY85 pKa = 9.9VLSKK89 pKa = 10.13RR90 pKa = 11.84DD91 pKa = 3.5SMSVGVHH98 pKa = 5.05NCGAGCHH105 pKa = 4.17VHH107 pKa = 6.3IRR109 pKa = 11.84RR110 pKa = 11.84NRR112 pKa = 3.16
MM1 pKa = 7.45ALSRR5 pKa = 11.84PPDD8 pKa = 3.5YY9 pKa = 11.15TKK11 pKa = 11.13VLLVSSLAVGTAIIIHH27 pKa = 5.9FLRR30 pKa = 11.84RR31 pKa = 11.84SEE33 pKa = 4.23LPHH36 pKa = 8.19VGDD39 pKa = 4.38NLHH42 pKa = 6.51HH43 pKa = 6.56LPYY46 pKa = 10.5GGSYY50 pKa = 10.83CDD52 pKa = 3.24GTKK55 pKa = 10.25RR56 pKa = 11.84INYY59 pKa = 8.54GGSHH63 pKa = 6.36NKK65 pKa = 9.75HH66 pKa = 6.0SLITFNPLLLVFILSALIYY85 pKa = 9.9VLSKK89 pKa = 10.13RR90 pKa = 11.84DD91 pKa = 3.5SMSVGVHH98 pKa = 5.05NCGAGCHH105 pKa = 4.17VHH107 pKa = 6.3IRR109 pKa = 11.84RR110 pKa = 11.84NRR112 pKa = 3.16
Molecular weight: 12.39 kDa
Isoelectric point according different methods:
Peptides (in silico digests for buttom-up proteomics)
Below you can find in silico digests of the whole proteome with Trypsin, Chymotrypsin, Trypsin+LysC, LysN, ArgC proteases suitable for different mass spec machines.| Try ESI |
 |
|---|
| ChTry ESI |
 |
|---|
| ArgC ESI |
 |
|---|
| LysN ESI |
 |
|---|
| TryLysC ESI |
 |
|---|
| Try MALDI |
 |
|---|
| ChTry MALDI |
 |
|---|
| ArgC MALDI |
 |
|---|
| LysN MALDI |
 |
|---|
| TryLysC MALDI |
 |
|---|
| Try LTQ |
 |
|---|
| ChTry LTQ |
 |
|---|
| ArgC LTQ |
 |
|---|
| LysN LTQ |
 |
|---|
| TryLysC LTQ |
 |
|---|
| Try MSlow |
 |
|---|
| ChTry MSlow |
 |
|---|
| ArgC MSlow |
 |
|---|
| LysN MSlow |
 |
|---|
| TryLysC MSlow |
 |
|---|
| Try MShigh |
 |
|---|
| ChTry MShigh |
 |
|---|
| ArgC MShigh |
 |
|---|
| LysN MShigh |
 |
|---|
| TryLysC MShigh |
 |
|---|
General Statistics
Number of major isoforms |
Number of additional isoforms |
Number of all proteins |
Number of amino acids |
Min. Seq. Length |
Max. Seq. Length |
Avg. Seq. Length |
Avg. Mol. Weight |
|---|---|---|---|---|---|---|---|
0 |
2415 |
70 |
1771 |
483.0 |
55.48 |
Amino acid frequency
Ala |
Cys |
Asp |
Glu |
Phe |
Gly |
His |
Ile |
Lys |
Leu |
|---|---|---|---|---|---|---|---|---|---|
4.803 ± 1.062 | 2.029 ± 0.263 |
5.135 ± 0.467 | 7.992 ± 0.991 |
5.507 ± 0.872 | 4.803 ± 0.711 |
2.484 ± 0.728 | 6.832 ± 0.344 |
8.323 ± 0.815 | 9.358 ± 0.864 |
Met |
Asn |
Gln |
Pro |
Arg |
Ser |
Thr |
Val |
Trp |
Tyr |
|---|---|---|---|---|---|---|---|---|---|
2.609 ± 0.569 | 6.087 ± 0.402 |
3.064 ± 0.274 | 2.816 ± 0.38 |
5.3 ± 0.511 | 7.453 ± 0.485 |
4.472 ± 0.183 | 6.832 ± 0.902 |
0.663 ± 0.258 | 3.437 ± 0.442 |
Most of the basic statistics you can see at this page can be downloaded from this CSV file
Proteome-pI is available under Creative Commons Attribution-NoDerivs license, for more details see here
| Reference: Kozlowski LP. Proteome-pI 2.0: Proteome Isoelectric Point Database Update. Nucleic Acids Res. 2021, doi: 10.1093/nar/gkab944 | Contact: Lukasz P. Kozlowski |
