Xanthomonas phage Pagan
Taxonomy: Viruses; Duplodnaviria; Heunggongvirae; Uroviricota; Caudoviricetes; Caudovirales; Autographiviridae; Pradovirus; unclassified Pradovirus
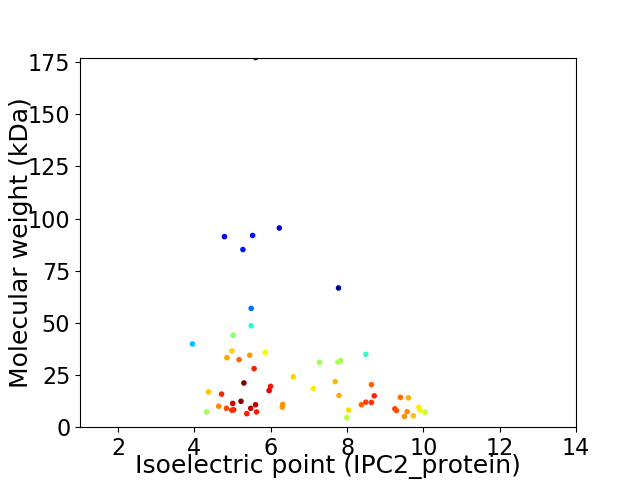
Average proteome isoelectric point is 6.7
Get precalculated fractions of proteins

Virtual 2D-PAGE plot for 59 proteins (isoelectric point calculated using IPC2_protein)
Get csv file with sequences according to given criteria:
* You can choose from 21 different methods for calculating isoelectric point
Summary statistics related to proteome-wise predictions


Protein with the lowest isoelectric point:
>tr|A0A5B9NE07|A0A5B9NE07_9CAUD O-spanin OS=Xanthomonas phage Pagan OX=2591104 GN=CPT_Pagan_058 PE=4 SV=1
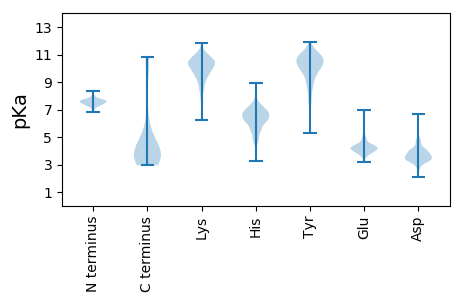
MM1 pKa = 7.62AVPDD5 pKa = 4.03PQLRR9 pKa = 11.84YY10 pKa = 8.97ATDD13 pKa = 3.14VFDD16 pKa = 5.53ADD18 pKa = 4.57GVTTDD23 pKa = 3.28WQISFTGGYY32 pKa = 9.41INPSHH37 pKa = 6.79VYY39 pKa = 10.73AMSGLLDD46 pKa = 4.23EE47 pKa = 4.81EE48 pKa = 4.78TQLLTDD54 pKa = 4.31RR55 pKa = 11.84TPHH58 pKa = 4.77TVEE61 pKa = 4.43VLSEE65 pKa = 4.69DD66 pKa = 4.26DD67 pKa = 3.73DD68 pKa = 5.62ASTVRR73 pKa = 11.84VSPAVAAGRR82 pKa = 11.84KK83 pKa = 9.05LYY85 pKa = 9.94IYY87 pKa = 10.25RR88 pKa = 11.84STPVQQMLVDD98 pKa = 3.85YY99 pKa = 10.22VNGSIISKK107 pKa = 9.44TNLNLSNDD115 pKa = 3.58QLLKK119 pKa = 10.39IIQEE123 pKa = 4.34MFDD126 pKa = 3.67SLNIATLSIDD136 pKa = 3.35QQVGVIVDD144 pKa = 4.16LNEE147 pKa = 4.43IIQNIYY153 pKa = 9.87KK154 pKa = 10.12QVTEE158 pKa = 4.35LLAAGGIVSVAPRR171 pKa = 11.84VWSGAWTGDD180 pKa = 3.52QVDD183 pKa = 4.08DD184 pKa = 4.18TDD186 pKa = 4.46FDD188 pKa = 4.03MVGADD193 pKa = 3.27VSGAGFYY200 pKa = 10.67DD201 pKa = 4.08VYY203 pKa = 11.61VNGIGMQPDD212 pKa = 2.79VDD214 pKa = 4.18YY215 pKa = 11.27QVTLADD221 pKa = 3.87DD222 pKa = 4.01TDD224 pKa = 3.84PSFIRR229 pKa = 11.84FATVPAEE236 pKa = 3.82GSIWFAVLRR245 pKa = 11.84GYY247 pKa = 10.59AKK249 pKa = 10.11PYY251 pKa = 9.02TGPAPITATSLRR263 pKa = 11.84VPIIPAEE270 pKa = 4.31GPTYY274 pKa = 10.52YY275 pKa = 10.68ADD277 pKa = 3.52KK278 pKa = 9.47ATEE281 pKa = 4.03YY282 pKa = 11.28GLVRR286 pKa = 11.84CTYY289 pKa = 11.1AGGCAVNINLIPEE302 pKa = 4.32VGDD305 pKa = 3.95GEE307 pKa = 4.63TKK309 pKa = 10.39LASGSYY315 pKa = 10.34FSVQQKK321 pKa = 10.22AGPVVITGDD330 pKa = 3.32VGVTLEE336 pKa = 4.26VPVGCTAATRR346 pKa = 11.84GTNSVVTATCIDD358 pKa = 3.65GDD360 pKa = 4.23TNTWLLSGDD369 pKa = 3.9LAKK372 pKa = 10.54EE373 pKa = 3.9
MM1 pKa = 7.62AVPDD5 pKa = 4.03PQLRR9 pKa = 11.84YY10 pKa = 8.97ATDD13 pKa = 3.14VFDD16 pKa = 5.53ADD18 pKa = 4.57GVTTDD23 pKa = 3.28WQISFTGGYY32 pKa = 9.41INPSHH37 pKa = 6.79VYY39 pKa = 10.73AMSGLLDD46 pKa = 4.23EE47 pKa = 4.81EE48 pKa = 4.78TQLLTDD54 pKa = 4.31RR55 pKa = 11.84TPHH58 pKa = 4.77TVEE61 pKa = 4.43VLSEE65 pKa = 4.69DD66 pKa = 4.26DD67 pKa = 3.73DD68 pKa = 5.62ASTVRR73 pKa = 11.84VSPAVAAGRR82 pKa = 11.84KK83 pKa = 9.05LYY85 pKa = 9.94IYY87 pKa = 10.25RR88 pKa = 11.84STPVQQMLVDD98 pKa = 3.85YY99 pKa = 10.22VNGSIISKK107 pKa = 9.44TNLNLSNDD115 pKa = 3.58QLLKK119 pKa = 10.39IIQEE123 pKa = 4.34MFDD126 pKa = 3.67SLNIATLSIDD136 pKa = 3.35QQVGVIVDD144 pKa = 4.16LNEE147 pKa = 4.43IIQNIYY153 pKa = 9.87KK154 pKa = 10.12QVTEE158 pKa = 4.35LLAAGGIVSVAPRR171 pKa = 11.84VWSGAWTGDD180 pKa = 3.52QVDD183 pKa = 4.08DD184 pKa = 4.18TDD186 pKa = 4.46FDD188 pKa = 4.03MVGADD193 pKa = 3.27VSGAGFYY200 pKa = 10.67DD201 pKa = 4.08VYY203 pKa = 11.61VNGIGMQPDD212 pKa = 2.79VDD214 pKa = 4.18YY215 pKa = 11.27QVTLADD221 pKa = 3.87DD222 pKa = 4.01TDD224 pKa = 3.84PSFIRR229 pKa = 11.84FATVPAEE236 pKa = 3.82GSIWFAVLRR245 pKa = 11.84GYY247 pKa = 10.59AKK249 pKa = 10.11PYY251 pKa = 9.02TGPAPITATSLRR263 pKa = 11.84VPIIPAEE270 pKa = 4.31GPTYY274 pKa = 10.52YY275 pKa = 10.68ADD277 pKa = 3.52KK278 pKa = 9.47ATEE281 pKa = 4.03YY282 pKa = 11.28GLVRR286 pKa = 11.84CTYY289 pKa = 11.1AGGCAVNINLIPEE302 pKa = 4.32VGDD305 pKa = 3.95GEE307 pKa = 4.63TKK309 pKa = 10.39LASGSYY315 pKa = 10.34FSVQQKK321 pKa = 10.22AGPVVITGDD330 pKa = 3.32VGVTLEE336 pKa = 4.26VPVGCTAATRR346 pKa = 11.84GTNSVVTATCIDD358 pKa = 3.65GDD360 pKa = 4.23TNTWLLSGDD369 pKa = 3.9LAKK372 pKa = 10.54EE373 pKa = 3.9
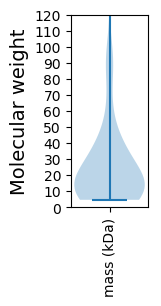
Molecular weight: 39.88 kDa
Isoelectric point according different methods:
Protein with the highest isoelectric point:
>tr|A0A5B9N6E2|A0A5B9N6E2_9CAUD Uncharacterized protein OS=Xanthomonas phage Pagan OX=2591104 GN=CPT_Pagan_015 PE=4 SV=1
MM1 pKa = 7.45IRR3 pKa = 11.84FKK5 pKa = 10.84FSRR8 pKa = 11.84HH9 pKa = 3.77YY10 pKa = 11.04VEE12 pKa = 5.32AARR15 pKa = 11.84DD16 pKa = 3.73SYY18 pKa = 11.68NRR20 pKa = 11.84AILKK24 pKa = 10.16HH25 pKa = 5.54PAGSVSALYY34 pKa = 9.98ILPCGGRR41 pKa = 11.84SFDD44 pKa = 4.0IRR46 pKa = 11.84LAA48 pKa = 3.82
MM1 pKa = 7.45IRR3 pKa = 11.84FKK5 pKa = 10.84FSRR8 pKa = 11.84HH9 pKa = 3.77YY10 pKa = 11.04VEE12 pKa = 5.32AARR15 pKa = 11.84DD16 pKa = 3.73SYY18 pKa = 11.68NRR20 pKa = 11.84AILKK24 pKa = 10.16HH25 pKa = 5.54PAGSVSALYY34 pKa = 9.98ILPCGGRR41 pKa = 11.84SFDD44 pKa = 4.0IRR46 pKa = 11.84LAA48 pKa = 3.82
Molecular weight: 5.46 kDa
Isoelectric point according different methods:
Peptides (in silico digests for buttom-up proteomics)
Below you can find in silico digests of the whole proteome with Trypsin, Chymotrypsin, Trypsin+LysC, LysN, ArgC proteases suitable for different mass spec machines.| Try ESI |
 |
|---|
| ChTry ESI |
 |
|---|
| ArgC ESI |
 |
|---|
| LysN ESI |
 |
|---|
| TryLysC ESI |
 |
|---|
| Try MALDI |
 |
|---|
| ChTry MALDI |
 |
|---|
| ArgC MALDI |
 |
|---|
| LysN MALDI |
 |
|---|
| TryLysC MALDI |
 |
|---|
| Try LTQ |
 |
|---|
| ChTry LTQ |
 |
|---|
| ArgC LTQ |
 |
|---|
| LysN LTQ |
 |
|---|
| TryLysC LTQ |
 |
|---|
| Try MSlow |
 |
|---|
| ChTry MSlow |
 |
|---|
| ArgC MSlow |
 |
|---|
| LysN MSlow |
 |
|---|
| TryLysC MSlow |
 |
|---|
| Try MShigh |
 |
|---|
| ChTry MShigh |
 |
|---|
| ArgC MShigh |
 |
|---|
| LysN MShigh |
 |
|---|
| TryLysC MShigh |
 |
|---|
General Statistics
Number of major isoforms |
Number of additional isoforms |
Number of all proteins |
Number of amino acids |
Min. Seq. Length |
Max. Seq. Length |
Avg. Seq. Length |
Avg. Mol. Weight |
|---|---|---|---|---|---|---|---|
0 |
14405 |
41 |
1636 |
244.2 |
26.94 |
Amino acid frequency
Ala |
Cys |
Asp |
Glu |
Phe |
Gly |
His |
Ile |
Lys |
Leu |
|---|---|---|---|---|---|---|---|---|---|
10.837 ± 0.617 | 1.0 ± 0.191 |
6.234 ± 0.177 | 5.699 ± 0.267 |
3.249 ± 0.149 | 8.101 ± 0.308 |
1.93 ± 0.186 | 4.45 ± 0.158 |
4.998 ± 0.356 | 8.108 ± 0.207 |
Met |
Asn |
Gln |
Pro |
Arg |
Ser |
Thr |
Val |
Trp |
Tyr |
|---|---|---|---|---|---|---|---|---|---|
2.652 ± 0.181 | 4.165 ± 0.208 |
4.276 ± 0.246 | 4.276 ± 0.225 |
6.276 ± 0.311 | 5.609 ± 0.33 |
6.192 ± 0.291 | 6.831 ± 0.304 |
1.722 ± 0.129 | 3.395 ± 0.186 |
Most of the basic statistics you can see at this page can be downloaded from this CSV file
Proteome-pI is available under Creative Commons Attribution-NoDerivs license, for more details see here
| Reference: Kozlowski LP. Proteome-pI 2.0: Proteome Isoelectric Point Database Update. Nucleic Acids Res. 2021, doi: 10.1093/nar/gkab944 | Contact: Lukasz P. Kozlowski |
