Blastopirellula cremea
Taxonomy: cellular organisms; Bacteria; PVC group; Planctomycetes; Planctomycetia; Pirellulales; Pirellulaceae; Blastopirellula
Average proteome isoelectric point is 5.97
Get precalculated fractions of proteins

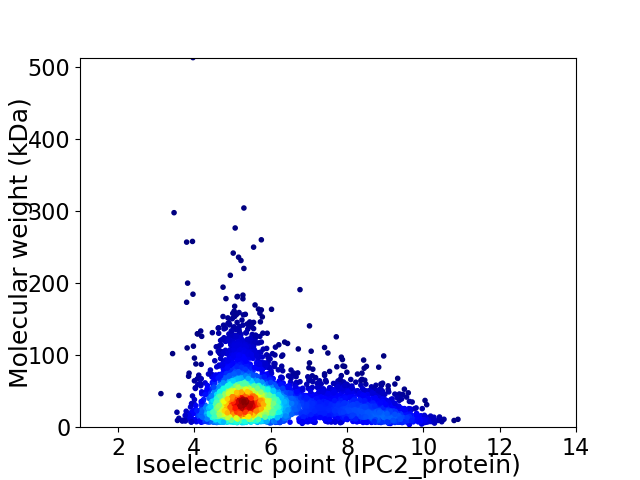
Virtual 2D-PAGE plot for 5042 proteins (isoelectric point calculated using IPC2_protein)
Get csv file with sequences according to given criteria:
* You can choose from 21 different methods for calculating isoelectric point
Summary statistics related to proteome-wise predictions


Protein with the lowest isoelectric point:
>tr|A0A368KRR4|A0A368KRR4_9BACT Uncharacterized protein OS=Blastopirellula cremea OX=1031537 GN=DTL42_17190 PE=4 SV=1
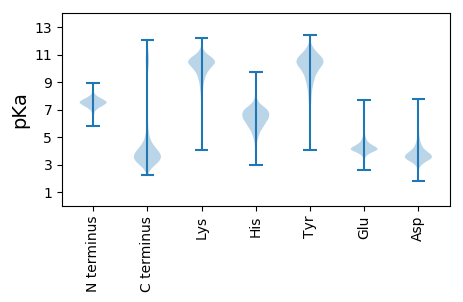
MM1 pKa = 7.6TDD3 pKa = 3.31YY4 pKa = 10.89NASDD8 pKa = 3.52VKK10 pKa = 10.13QQQVAYY16 pKa = 9.04TYY18 pKa = 11.41DD19 pKa = 3.32LFNRR23 pKa = 11.84LIGRR27 pKa = 11.84KK28 pKa = 9.07LDD30 pKa = 3.52SDD32 pKa = 3.89GDD34 pKa = 4.1GTVDD38 pKa = 3.46QSGTFIYY45 pKa = 10.85DD46 pKa = 3.14GDD48 pKa = 4.07QIMLQIDD55 pKa = 3.68DD56 pKa = 4.3NGEE59 pKa = 3.72VDD61 pKa = 5.81HH62 pKa = 6.96RR63 pKa = 11.84LLWRR67 pKa = 11.84ANVDD71 pKa = 3.33QLLADD76 pKa = 4.25EE77 pKa = 4.69NASGDD82 pKa = 4.19VYY84 pKa = 10.67WALTDD89 pKa = 3.67HH90 pKa = 6.9LNTVHH95 pKa = 7.44DD96 pKa = 3.77WAEE99 pKa = 4.02YY100 pKa = 11.03DD101 pKa = 4.59DD102 pKa = 5.03LTDD105 pKa = 3.33TTSVVNHH112 pKa = 6.62IAYY115 pKa = 9.68DD116 pKa = 3.38AFGNVLSEE124 pKa = 4.44TNATLDD130 pKa = 3.33TTGFGFTARR139 pKa = 11.84YY140 pKa = 8.89FDD142 pKa = 4.09EE143 pKa = 4.69ATGLQYY149 pKa = 9.88NTNRR153 pKa = 11.84WYY155 pKa = 10.58NAQLGRR161 pKa = 11.84WMSPDD166 pKa = 4.14PIGFEE171 pKa = 4.18AGDD174 pKa = 3.78EE175 pKa = 3.93NLYY178 pKa = 10.48RR179 pKa = 11.84YY180 pKa = 9.33VGNEE184 pKa = 3.54VTVFTDD190 pKa = 3.79PSGLEE195 pKa = 3.93EE196 pKa = 4.04
MM1 pKa = 7.6TDD3 pKa = 3.31YY4 pKa = 10.89NASDD8 pKa = 3.52VKK10 pKa = 10.13QQQVAYY16 pKa = 9.04TYY18 pKa = 11.41DD19 pKa = 3.32LFNRR23 pKa = 11.84LIGRR27 pKa = 11.84KK28 pKa = 9.07LDD30 pKa = 3.52SDD32 pKa = 3.89GDD34 pKa = 4.1GTVDD38 pKa = 3.46QSGTFIYY45 pKa = 10.85DD46 pKa = 3.14GDD48 pKa = 4.07QIMLQIDD55 pKa = 3.68DD56 pKa = 4.3NGEE59 pKa = 3.72VDD61 pKa = 5.81HH62 pKa = 6.96RR63 pKa = 11.84LLWRR67 pKa = 11.84ANVDD71 pKa = 3.33QLLADD76 pKa = 4.25EE77 pKa = 4.69NASGDD82 pKa = 4.19VYY84 pKa = 10.67WALTDD89 pKa = 3.67HH90 pKa = 6.9LNTVHH95 pKa = 7.44DD96 pKa = 3.77WAEE99 pKa = 4.02YY100 pKa = 11.03DD101 pKa = 4.59DD102 pKa = 5.03LTDD105 pKa = 3.33TTSVVNHH112 pKa = 6.62IAYY115 pKa = 9.68DD116 pKa = 3.38AFGNVLSEE124 pKa = 4.44TNATLDD130 pKa = 3.33TTGFGFTARR139 pKa = 11.84YY140 pKa = 8.89FDD142 pKa = 4.09EE143 pKa = 4.69ATGLQYY149 pKa = 9.88NTNRR153 pKa = 11.84WYY155 pKa = 10.58NAQLGRR161 pKa = 11.84WMSPDD166 pKa = 4.14PIGFEE171 pKa = 4.18AGDD174 pKa = 3.78EE175 pKa = 3.93NLYY178 pKa = 10.48RR179 pKa = 11.84YY180 pKa = 9.33VGNEE184 pKa = 3.54VTVFTDD190 pKa = 3.79PSGLEE195 pKa = 3.93EE196 pKa = 4.04
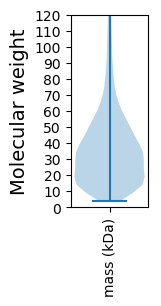
Molecular weight: 22.17 kDa
Isoelectric point according different methods:
Protein with the highest isoelectric point:
>tr|A0A368KQZ0|A0A368KQZ0_9BACT Uncharacterized protein OS=Blastopirellula cremea OX=1031537 GN=DTL42_12240 PE=4 SV=1
MM1 pKa = 7.19ATLAGVRR8 pKa = 11.84QRR10 pKa = 11.84LIEE13 pKa = 4.12SCLIMNLPILRR24 pKa = 11.84MRR26 pKa = 11.84IAGNLIACVIHH37 pKa = 6.31MYY39 pKa = 10.78VDD41 pKa = 3.82TLRR44 pKa = 11.84LGSQRR49 pKa = 11.84RR50 pKa = 11.84GLCTLTSHH58 pKa = 6.85GGGWHH63 pKa = 5.43WRR65 pKa = 11.84MKK67 pKa = 9.09PLCVPRR73 pKa = 11.84CLWPVPGKK81 pKa = 10.15QGHH84 pKa = 5.74AQPGNQAARR93 pKa = 11.84VRR95 pKa = 11.84LFSAALEE102 pKa = 4.55SVASLPLAVVDD113 pKa = 4.1FRR115 pKa = 11.84EE116 pKa = 4.8AKK118 pKa = 9.75RR119 pKa = 11.84HH120 pKa = 5.13PNPGKK125 pKa = 9.54MPGAPGVFAINVLLKK140 pKa = 10.43LVPFVSGLVFSAYY153 pKa = 9.87EE154 pKa = 3.86CLQLVKK160 pKa = 10.93
MM1 pKa = 7.19ATLAGVRR8 pKa = 11.84QRR10 pKa = 11.84LIEE13 pKa = 4.12SCLIMNLPILRR24 pKa = 11.84MRR26 pKa = 11.84IAGNLIACVIHH37 pKa = 6.31MYY39 pKa = 10.78VDD41 pKa = 3.82TLRR44 pKa = 11.84LGSQRR49 pKa = 11.84RR50 pKa = 11.84GLCTLTSHH58 pKa = 6.85GGGWHH63 pKa = 5.43WRR65 pKa = 11.84MKK67 pKa = 9.09PLCVPRR73 pKa = 11.84CLWPVPGKK81 pKa = 10.15QGHH84 pKa = 5.74AQPGNQAARR93 pKa = 11.84VRR95 pKa = 11.84LFSAALEE102 pKa = 4.55SVASLPLAVVDD113 pKa = 4.1FRR115 pKa = 11.84EE116 pKa = 4.8AKK118 pKa = 9.75RR119 pKa = 11.84HH120 pKa = 5.13PNPGKK125 pKa = 9.54MPGAPGVFAINVLLKK140 pKa = 10.43LVPFVSGLVFSAYY153 pKa = 9.87EE154 pKa = 3.86CLQLVKK160 pKa = 10.93
Molecular weight: 17.52 kDa
Isoelectric point according different methods:
Peptides (in silico digests for buttom-up proteomics)
Below you can find in silico digests of the whole proteome with Trypsin, Chymotrypsin, Trypsin+LysC, LysN, ArgC proteases suitable for different mass spec machines.| Try ESI |
 |
|---|
| ChTry ESI |
 |
|---|
| ArgC ESI |
 |
|---|
| LysN ESI |
 |
|---|
| TryLysC ESI |
 |
|---|
| Try MALDI |
 |
|---|
| ChTry MALDI |
 |
|---|
| ArgC MALDI |
 |
|---|
| LysN MALDI |
 |
|---|
| TryLysC MALDI |
 |
|---|
| Try LTQ |
 |
|---|
| ChTry LTQ |
 |
|---|
| ArgC LTQ |
 |
|---|
| LysN LTQ |
 |
|---|
| TryLysC LTQ |
 |
|---|
| Try MSlow |
 |
|---|
| ChTry MSlow |
 |
|---|
| ArgC MSlow |
 |
|---|
| LysN MSlow |
 |
|---|
| TryLysC MSlow |
 |
|---|
| Try MShigh |
 |
|---|
| ChTry MShigh |
 |
|---|
| ArgC MShigh |
 |
|---|
| LysN MShigh |
 |
|---|
| TryLysC MShigh |
 |
|---|
General Statistics
Number of major isoforms |
Number of additional isoforms |
Number of all proteins |
Number of amino acids |
Min. Seq. Length |
Max. Seq. Length |
Avg. Seq. Length |
Avg. Mol. Weight |
|---|---|---|---|---|---|---|---|
0 |
1789957 |
29 |
4800 |
355.0 |
39.3 |
Amino acid frequency
Ala |
Cys |
Asp |
Glu |
Phe |
Gly |
His |
Ile |
Lys |
Leu |
|---|---|---|---|---|---|---|---|---|---|
9.296 ± 0.037 | 1.102 ± 0.014 |
5.709 ± 0.027 | 6.596 ± 0.026 |
3.849 ± 0.018 | 7.365 ± 0.032 |
2.206 ± 0.015 | 5.356 ± 0.023 |
4.234 ± 0.03 | 10.005 ± 0.035 |
Met |
Asn |
Gln |
Pro |
Arg |
Ser |
Thr |
Val |
Trp |
Tyr |
|---|---|---|---|---|---|---|---|---|---|
2.332 ± 0.017 | 3.443 ± 0.024 |
5.234 ± 0.024 | 4.548 ± 0.03 |
5.862 ± 0.031 | 6.149 ± 0.028 |
5.505 ± 0.031 | 7.004 ± 0.025 |
1.532 ± 0.013 | 2.671 ± 0.018 |
Most of the basic statistics you can see at this page can be downloaded from this CSV file
Proteome-pI is available under Creative Commons Attribution-NoDerivs license, for more details see here
| Reference: Kozlowski LP. Proteome-pI 2.0: Proteome Isoelectric Point Database Update. Nucleic Acids Res. 2021, doi: 10.1093/nar/gkab944 | Contact: Lukasz P. Kozlowski |
