Streptomyces sp. SLBN-118
Taxonomy: cellular organisms; Bacteria; Terrabacteria group; Actinobacteria; Actinomycetia; Streptomycetales; Streptomycetaceae; Streptomyces; unclassified Streptomyces
Average proteome isoelectric point is 6.4
Get precalculated fractions of proteins

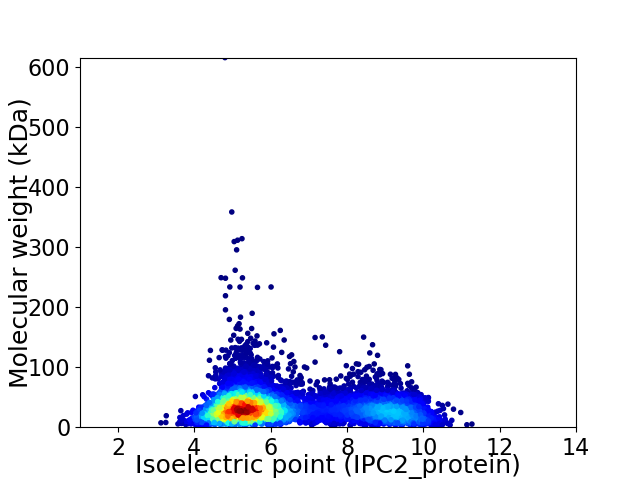
Virtual 2D-PAGE plot for 6747 proteins (isoelectric point calculated using IPC2_protein)
Get csv file with sequences according to given criteria:
* You can choose from 21 different methods for calculating isoelectric point
Summary statistics related to proteome-wise predictions


Protein with the lowest isoelectric point:
>tr|A0A542QLB9|A0A542QLB9_9ACTN Uncharacterized protein OS=Streptomyces sp. SLBN-118 OX=2768454 GN=FBY35_1189 PE=4 SV=1
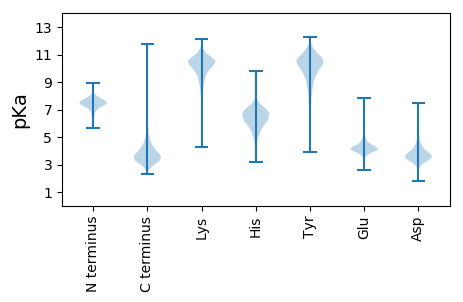
MM1 pKa = 7.7LSTRR5 pKa = 11.84FVTGSPNWIDD15 pKa = 5.02LGTPDD20 pKa = 5.41LDD22 pKa = 3.98AATAFYY28 pKa = 10.9GGLFGWTFQSAGPDD42 pKa = 2.99AGGYY46 pKa = 10.66GMYY49 pKa = 10.15QVDD52 pKa = 3.98GKK54 pKa = 8.82TVAGAMTVTPEE65 pKa = 3.74QGGPGWTVYY74 pKa = 9.86FQSPDD79 pKa = 3.14ADD81 pKa = 3.55GTAKK85 pKa = 10.44AVQAGGGAVLFEE97 pKa = 4.44PMDD100 pKa = 3.65VFEE103 pKa = 5.41LGRR106 pKa = 11.84MAVFTDD112 pKa = 3.37PGGAAFATWQPGQNKK127 pKa = 9.75GLDD130 pKa = 3.49AVNDD134 pKa = 4.28PNTLCWAEE142 pKa = 5.25LYY144 pKa = 10.4TEE146 pKa = 4.94DD147 pKa = 4.67PGAGLIFYY155 pKa = 10.17QGVFGWEE162 pKa = 3.88TSMMPLPDD170 pKa = 3.43GTGSYY175 pKa = 10.27TMINPAGAGAEE186 pKa = 4.04AMFGGIVPLAADD198 pKa = 3.9PLEE201 pKa = 4.51TEE203 pKa = 4.17GPYY206 pKa = 9.3WLPYY210 pKa = 10.42FEE212 pKa = 5.53VTDD215 pKa = 3.93CDD217 pKa = 3.65AAVATAQQLGGSVRR231 pKa = 11.84MAPVDD236 pKa = 3.5MEE238 pKa = 4.49GVGRR242 pKa = 11.84FAKK245 pKa = 10.62LADD248 pKa = 3.54PAGARR253 pKa = 11.84FALMQGVQQDD263 pKa = 3.74DD264 pKa = 3.37
MM1 pKa = 7.7LSTRR5 pKa = 11.84FVTGSPNWIDD15 pKa = 5.02LGTPDD20 pKa = 5.41LDD22 pKa = 3.98AATAFYY28 pKa = 10.9GGLFGWTFQSAGPDD42 pKa = 2.99AGGYY46 pKa = 10.66GMYY49 pKa = 10.15QVDD52 pKa = 3.98GKK54 pKa = 8.82TVAGAMTVTPEE65 pKa = 3.74QGGPGWTVYY74 pKa = 9.86FQSPDD79 pKa = 3.14ADD81 pKa = 3.55GTAKK85 pKa = 10.44AVQAGGGAVLFEE97 pKa = 4.44PMDD100 pKa = 3.65VFEE103 pKa = 5.41LGRR106 pKa = 11.84MAVFTDD112 pKa = 3.37PGGAAFATWQPGQNKK127 pKa = 9.75GLDD130 pKa = 3.49AVNDD134 pKa = 4.28PNTLCWAEE142 pKa = 5.25LYY144 pKa = 10.4TEE146 pKa = 4.94DD147 pKa = 4.67PGAGLIFYY155 pKa = 10.17QGVFGWEE162 pKa = 3.88TSMMPLPDD170 pKa = 3.43GTGSYY175 pKa = 10.27TMINPAGAGAEE186 pKa = 4.04AMFGGIVPLAADD198 pKa = 3.9PLEE201 pKa = 4.51TEE203 pKa = 4.17GPYY206 pKa = 9.3WLPYY210 pKa = 10.42FEE212 pKa = 5.53VTDD215 pKa = 3.93CDD217 pKa = 3.65AAVATAQQLGGSVRR231 pKa = 11.84MAPVDD236 pKa = 3.5MEE238 pKa = 4.49GVGRR242 pKa = 11.84FAKK245 pKa = 10.62LADD248 pKa = 3.54PAGARR253 pKa = 11.84FALMQGVQQDD263 pKa = 3.74DD264 pKa = 3.37
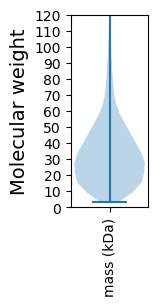
Molecular weight: 27.53 kDa
Isoelectric point according different methods:
Protein with the highest isoelectric point:
>tr|A0A542QSP5|A0A542QSP5_9ACTN Alanine racemase-like protein OS=Streptomyces sp. SLBN-118 OX=2768454 GN=FBY35_3568 PE=4 SV=1
MM1 pKa = 7.69SKK3 pKa = 9.0RR4 pKa = 11.84TFQPNNRR11 pKa = 11.84RR12 pKa = 11.84RR13 pKa = 11.84AKK15 pKa = 8.7THH17 pKa = 5.15GFRR20 pKa = 11.84LRR22 pKa = 11.84MRR24 pKa = 11.84TRR26 pKa = 11.84AGRR29 pKa = 11.84AILANRR35 pKa = 11.84RR36 pKa = 11.84GKK38 pKa = 10.51GRR40 pKa = 11.84ASLSAA45 pKa = 3.83
MM1 pKa = 7.69SKK3 pKa = 9.0RR4 pKa = 11.84TFQPNNRR11 pKa = 11.84RR12 pKa = 11.84RR13 pKa = 11.84AKK15 pKa = 8.7THH17 pKa = 5.15GFRR20 pKa = 11.84LRR22 pKa = 11.84MRR24 pKa = 11.84TRR26 pKa = 11.84AGRR29 pKa = 11.84AILANRR35 pKa = 11.84RR36 pKa = 11.84GKK38 pKa = 10.51GRR40 pKa = 11.84ASLSAA45 pKa = 3.83
Molecular weight: 5.21 kDa
Isoelectric point according different methods:
Peptides (in silico digests for buttom-up proteomics)
Below you can find in silico digests of the whole proteome with Trypsin, Chymotrypsin, Trypsin+LysC, LysN, ArgC proteases suitable for different mass spec machines.| Try ESI |
 |
|---|
| ChTry ESI |
 |
|---|
| ArgC ESI |
 |
|---|
| LysN ESI |
 |
|---|
| TryLysC ESI |
 |
|---|
| Try MALDI |
 |
|---|
| ChTry MALDI |
 |
|---|
| ArgC MALDI |
 |
|---|
| LysN MALDI |
 |
|---|
| TryLysC MALDI |
 |
|---|
| Try LTQ |
 |
|---|
| ChTry LTQ |
 |
|---|
| ArgC LTQ |
 |
|---|
| LysN LTQ |
 |
|---|
| TryLysC LTQ |
 |
|---|
| Try MSlow |
 |
|---|
| ChTry MSlow |
 |
|---|
| ArgC MSlow |
 |
|---|
| LysN MSlow |
 |
|---|
| TryLysC MSlow |
 |
|---|
| Try MShigh |
 |
|---|
| ChTry MShigh |
 |
|---|
| ArgC MShigh |
 |
|---|
| LysN MShigh |
 |
|---|
| TryLysC MShigh |
 |
|---|
General Statistics
Number of major isoforms |
Number of additional isoforms |
Number of all proteins |
Number of amino acids |
Min. Seq. Length |
Max. Seq. Length |
Avg. Seq. Length |
Avg. Mol. Weight |
|---|---|---|---|---|---|---|---|
0 |
2213585 |
29 |
5832 |
328.1 |
35.19 |
Amino acid frequency
Ala |
Cys |
Asp |
Glu |
Phe |
Gly |
His |
Ile |
Lys |
Leu |
|---|---|---|---|---|---|---|---|---|---|
13.305 ± 0.045 | 0.839 ± 0.009 |
5.87 ± 0.022 | 5.785 ± 0.029 |
2.724 ± 0.017 | 9.313 ± 0.029 |
2.281 ± 0.014 | 3.427 ± 0.021 |
2.42 ± 0.028 | 10.186 ± 0.04 |
Met |
Asn |
Gln |
Pro |
Arg |
Ser |
Thr |
Val |
Trp |
Tyr |
|---|---|---|---|---|---|---|---|---|---|
1.829 ± 0.011 | 1.875 ± 0.019 |
6.014 ± 0.028 | 2.978 ± 0.018 |
7.84 ± 0.037 | 5.324 ± 0.024 |
6.062 ± 0.03 | 8.293 ± 0.03 |
1.516 ± 0.013 | 2.12 ± 0.018 |
Most of the basic statistics you can see at this page can be downloaded from this CSV file
Proteome-pI is available under Creative Commons Attribution-NoDerivs license, for more details see here
| Reference: Kozlowski LP. Proteome-pI 2.0: Proteome Isoelectric Point Database Update. Nucleic Acids Res. 2021, doi: 10.1093/nar/gkab944 | Contact: Lukasz P. Kozlowski |
