Novosphingobium tardaugens NBRC 16725
Taxonomy: cellular organisms; Bacteria; Proteobacteria; Alphaproteobacteria; Hyphomicrobiales; Hyphomicrobiaceae; Caenibius; Caenibius tardaugens
Average proteome isoelectric point is 6.34
Get precalculated fractions of proteins

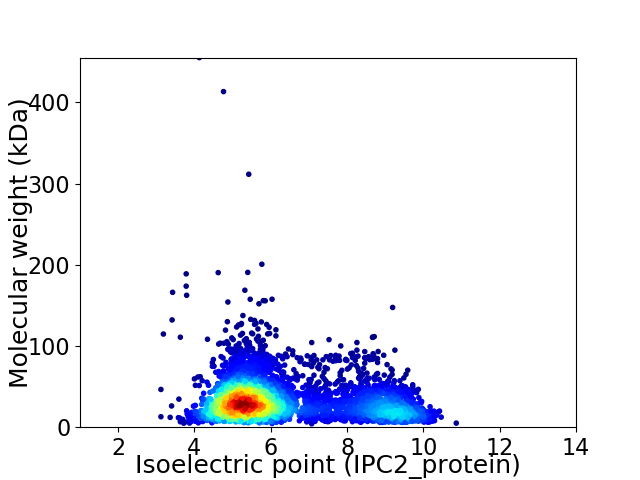
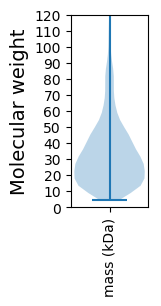
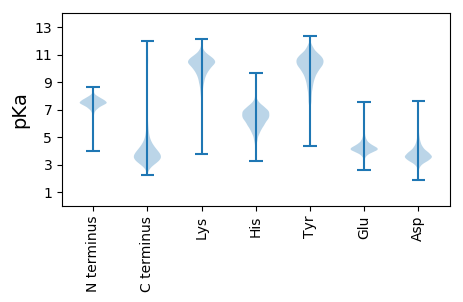
Virtual 2D-PAGE plot for 4005 proteins (isoelectric point calculated using IPC2_protein)
Get csv file with sequences according to given criteria:
* You can choose from 21 different methods for calculating isoelectric point
Summary statistics related to proteome-wise predictions


Protein with the lowest isoelectric point:
>tr|U2ZYM3|U2ZYM3_9SPHN Uncharacterized protein OS=Novosphingobium tardaugens NBRC 16725 OX=1219035 GN=NT2_01_03990 PE=4 SV=1
MM1 pKa = 7.85KK2 pKa = 10.45YY3 pKa = 10.67LLLSAVAASAMLAASPAYY21 pKa = 10.06ANRR24 pKa = 11.84DD25 pKa = 3.38RR26 pKa = 11.84DD27 pKa = 3.74HH28 pKa = 7.2GSDD31 pKa = 3.01IDD33 pKa = 4.14VNYY36 pKa = 10.11EE37 pKa = 3.94NNIKK41 pKa = 9.73TSIVTDD47 pKa = 3.11VAYY50 pKa = 10.73YY51 pKa = 10.78KK52 pKa = 10.71DD53 pKa = 3.54VALEE57 pKa = 4.2GTVSLEE63 pKa = 3.76GTISVDD69 pKa = 3.12SSAVAVTDD77 pKa = 3.57VKK79 pKa = 10.96QLSGLNNVTYY89 pKa = 10.63RR90 pKa = 11.84EE91 pKa = 4.04EE92 pKa = 4.21NEE94 pKa = 4.06LNGEE98 pKa = 4.01NGYY101 pKa = 10.73VSDD104 pKa = 3.89IFGPGWSEE112 pKa = 4.74AGNDD116 pKa = 3.86PNDD119 pKa = 3.44NLTNGVLEE127 pKa = 4.02GAIRR131 pKa = 11.84VGYY134 pKa = 7.67FAPIINTVDD143 pKa = 3.12AFDD146 pKa = 3.53VSGAGNIGVNLSAGYY161 pKa = 11.38YY162 pKa = 8.64NMQMNSATLASSSVQDD178 pKa = 3.93PDD180 pKa = 4.89ASGGWSEE187 pKa = 5.4ASTTSLQMLVGTYY200 pKa = 9.87QYY202 pKa = 11.38GAEE205 pKa = 4.05TDD207 pKa = 3.88VLPEE211 pKa = 5.17DD212 pKa = 5.03DD213 pKa = 4.34PTDD216 pKa = 3.73GGGGNNFRR224 pKa = 11.84DD225 pKa = 4.07RR226 pKa = 11.84NTVMGGAVSGDD237 pKa = 3.33GNIGINAAAGSFNQQANLLTLAVATDD263 pKa = 3.45AALAEE268 pKa = 4.65ANSGLLQIAVFNGVEE283 pKa = 4.08QQDD286 pKa = 4.2SINTVGTLTIADD298 pKa = 3.45ASGNIGVNMAAGVGNQQLNSLTIATSLASGGGDD331 pKa = 3.32GNGGGGGDD339 pKa = 3.79GSS341 pKa = 3.85
MM1 pKa = 7.85KK2 pKa = 10.45YY3 pKa = 10.67LLLSAVAASAMLAASPAYY21 pKa = 10.06ANRR24 pKa = 11.84DD25 pKa = 3.38RR26 pKa = 11.84DD27 pKa = 3.74HH28 pKa = 7.2GSDD31 pKa = 3.01IDD33 pKa = 4.14VNYY36 pKa = 10.11EE37 pKa = 3.94NNIKK41 pKa = 9.73TSIVTDD47 pKa = 3.11VAYY50 pKa = 10.73YY51 pKa = 10.78KK52 pKa = 10.71DD53 pKa = 3.54VALEE57 pKa = 4.2GTVSLEE63 pKa = 3.76GTISVDD69 pKa = 3.12SSAVAVTDD77 pKa = 3.57VKK79 pKa = 10.96QLSGLNNVTYY89 pKa = 10.63RR90 pKa = 11.84EE91 pKa = 4.04EE92 pKa = 4.21NEE94 pKa = 4.06LNGEE98 pKa = 4.01NGYY101 pKa = 10.73VSDD104 pKa = 3.89IFGPGWSEE112 pKa = 4.74AGNDD116 pKa = 3.86PNDD119 pKa = 3.44NLTNGVLEE127 pKa = 4.02GAIRR131 pKa = 11.84VGYY134 pKa = 7.67FAPIINTVDD143 pKa = 3.12AFDD146 pKa = 3.53VSGAGNIGVNLSAGYY161 pKa = 11.38YY162 pKa = 8.64NMQMNSATLASSSVQDD178 pKa = 3.93PDD180 pKa = 4.89ASGGWSEE187 pKa = 5.4ASTTSLQMLVGTYY200 pKa = 9.87QYY202 pKa = 11.38GAEE205 pKa = 4.05TDD207 pKa = 3.88VLPEE211 pKa = 5.17DD212 pKa = 5.03DD213 pKa = 4.34PTDD216 pKa = 3.73GGGGNNFRR224 pKa = 11.84DD225 pKa = 4.07RR226 pKa = 11.84NTVMGGAVSGDD237 pKa = 3.33GNIGINAAAGSFNQQANLLTLAVATDD263 pKa = 3.45AALAEE268 pKa = 4.65ANSGLLQIAVFNGVEE283 pKa = 4.08QQDD286 pKa = 4.2SINTVGTLTIADD298 pKa = 3.45ASGNIGVNMAAGVGNQQLNSLTIATSLASGGGDD331 pKa = 3.32GNGGGGGDD339 pKa = 3.79GSS341 pKa = 3.85
Molecular weight: 34.57 kDa
Isoelectric point according different methods:
Protein with the highest isoelectric point:
>tr|U2Y5W4|U2Y5W4_9SPHN Putative multidrug resistance protein B OS=Novosphingobium tardaugens NBRC 16725 OX=1219035 GN=NT2_03_00140 PE=4 SV=1
MM1 pKa = 7.59LRR3 pKa = 11.84PSHH6 pKa = 6.45TILRR10 pKa = 11.84ATILRR15 pKa = 11.84PALCATLLAAGLASPAMARR34 pKa = 11.84DD35 pKa = 3.28SLGIYY40 pKa = 9.79DD41 pKa = 3.19SWGAFRR47 pKa = 11.84DD48 pKa = 3.8PGAQPRR54 pKa = 11.84CYY56 pKa = 10.3AIAKK60 pKa = 8.42ANPGTARR67 pKa = 11.84RR68 pKa = 11.84DD69 pKa = 3.86FEE71 pKa = 4.24PTASVGTWPKK81 pKa = 10.27RR82 pKa = 11.84QIRR85 pKa = 11.84NQIHH89 pKa = 5.78FRR91 pKa = 11.84LSRR94 pKa = 11.84KK95 pKa = 9.11ILPAGKK101 pKa = 8.26ITLFLGGKK109 pKa = 9.45RR110 pKa = 11.84FALTGGGADD119 pKa = 3.3AWAVDD124 pKa = 3.68AAMDD128 pKa = 4.08AAIVAAMRR136 pKa = 11.84SAGSMSVSALDD147 pKa = 3.47EE148 pKa = 4.52RR149 pKa = 11.84GNAFTNTYY157 pKa = 9.63GLAGAATALDD167 pKa = 3.94AALLGCAKK175 pKa = 10.3LRR177 pKa = 3.98
MM1 pKa = 7.59LRR3 pKa = 11.84PSHH6 pKa = 6.45TILRR10 pKa = 11.84ATILRR15 pKa = 11.84PALCATLLAAGLASPAMARR34 pKa = 11.84DD35 pKa = 3.28SLGIYY40 pKa = 9.79DD41 pKa = 3.19SWGAFRR47 pKa = 11.84DD48 pKa = 3.8PGAQPRR54 pKa = 11.84CYY56 pKa = 10.3AIAKK60 pKa = 8.42ANPGTARR67 pKa = 11.84RR68 pKa = 11.84DD69 pKa = 3.86FEE71 pKa = 4.24PTASVGTWPKK81 pKa = 10.27RR82 pKa = 11.84QIRR85 pKa = 11.84NQIHH89 pKa = 5.78FRR91 pKa = 11.84LSRR94 pKa = 11.84KK95 pKa = 9.11ILPAGKK101 pKa = 8.26ITLFLGGKK109 pKa = 9.45RR110 pKa = 11.84FALTGGGADD119 pKa = 3.3AWAVDD124 pKa = 3.68AAMDD128 pKa = 4.08AAIVAAMRR136 pKa = 11.84SAGSMSVSALDD147 pKa = 3.47EE148 pKa = 4.52RR149 pKa = 11.84GNAFTNTYY157 pKa = 9.63GLAGAATALDD167 pKa = 3.94AALLGCAKK175 pKa = 10.3LRR177 pKa = 3.98
Molecular weight: 18.54 kDa
Isoelectric point according different methods:
Peptides (in silico digests for buttom-up proteomics)
Below you can find in silico digests of the whole proteome with Trypsin, Chymotrypsin, Trypsin+LysC, LysN, ArgC proteases suitable for different mass spec machines.| Try ESI |
 |
|---|
| ChTry ESI |
 |
|---|
| ArgC ESI |
 |
|---|
| LysN ESI |
 |
|---|
| TryLysC ESI |
 |
|---|
| Try MALDI |
 |
|---|
| ChTry MALDI |
 |
|---|
| ArgC MALDI |
 |
|---|
| LysN MALDI |
 |
|---|
| TryLysC MALDI |
 |
|---|
| Try LTQ |
 |
|---|
| ChTry LTQ |
 |
|---|
| ArgC LTQ |
 |
|---|
| LysN LTQ |
 |
|---|
| TryLysC LTQ |
 |
|---|
| Try MSlow |
 |
|---|
| ChTry MSlow |
 |
|---|
| ArgC MSlow |
 |
|---|
| LysN MSlow |
 |
|---|
| TryLysC MSlow |
 |
|---|
| Try MShigh |
 |
|---|
| ChTry MShigh |
 |
|---|
| ArgC MShigh |
 |
|---|
| LysN MShigh |
 |
|---|
| TryLysC MShigh |
 |
|---|
General Statistics
Number of major isoforms |
Number of additional isoforms |
Number of all proteins |
Number of amino acids |
Min. Seq. Length |
Max. Seq. Length |
Avg. Seq. Length |
Avg. Mol. Weight |
|---|---|---|---|---|---|---|---|
0 |
1284881 |
41 |
4966 |
320.8 |
34.74 |
Amino acid frequency
Ala |
Cys |
Asp |
Glu |
Phe |
Gly |
His |
Ile |
Lys |
Leu |
|---|---|---|---|---|---|---|---|---|---|
12.777 ± 0.056 | 0.851 ± 0.014 |
6.077 ± 0.029 | 5.391 ± 0.037 |
3.599 ± 0.027 | 8.947 ± 0.088 |
2.107 ± 0.02 | 5.157 ± 0.026 |
2.99 ± 0.028 | 9.75 ± 0.045 |
Met |
Asn |
Gln |
Pro |
Arg |
Ser |
Thr |
Val |
Trp |
Tyr |
|---|---|---|---|---|---|---|---|---|---|
2.493 ± 0.022 | 2.788 ± 0.029 |
5.21 ± 0.032 | 3.345 ± 0.021 |
7.064 ± 0.047 | 5.269 ± 0.03 |
5.337 ± 0.036 | 7.058 ± 0.033 |
1.432 ± 0.016 | 2.36 ± 0.023 |
Most of the basic statistics you can see at this page can be downloaded from this CSV file
Proteome-pI is available under Creative Commons Attribution-NoDerivs license, for more details see here
| Reference: Kozlowski LP. Proteome-pI 2.0: Proteome Isoelectric Point Database Update. Nucleic Acids Res. 2021, doi: 10.1093/nar/gkab944 | Contact: Lukasz P. Kozlowski |
