Thalassomonas actiniarum
Taxonomy: cellular organisms; Bacteria; Proteobacteria; Gammaproteobacteria; Alteromonadales; Colwelliaceae; Thalassomonas
Average proteome isoelectric point is 6.25
Get precalculated fractions of proteins

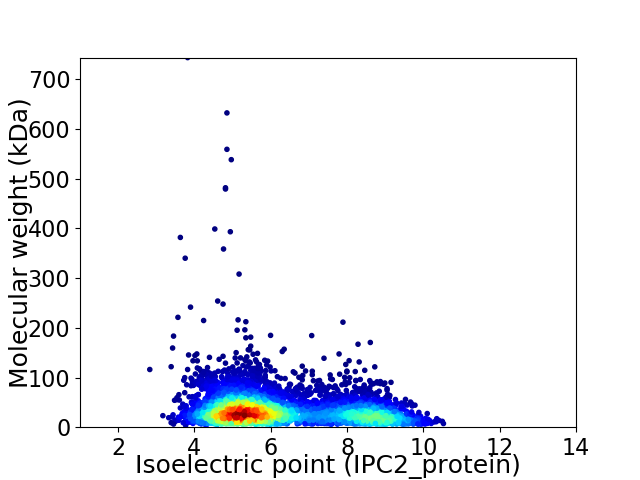
Virtual 2D-PAGE plot for 5460 proteins (isoelectric point calculated using IPC2_protein)
Get csv file with sequences according to given criteria:
* You can choose from 21 different methods for calculating isoelectric point
Summary statistics related to proteome-wise predictions


Protein with the lowest isoelectric point:
>tr|A0A0D8D3D5|A0A0D8D3D5_9GAMM Uncharacterized protein OS=Thalassomonas actiniarum OX=485447 GN=SG35_04430 PE=4 SV=1
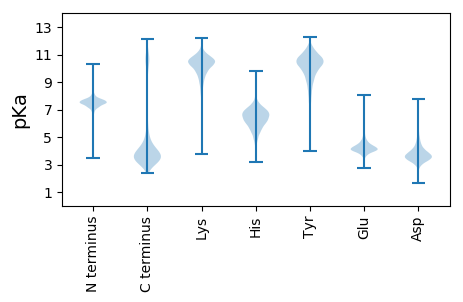
MM1 pKa = 7.37KK2 pKa = 9.96KK3 pKa = 10.28AAIALTLTTLLSASVQADD21 pKa = 3.71TLLGVYY27 pKa = 10.51FGGQVWDD34 pKa = 4.14NEE36 pKa = 4.31AEE38 pKa = 4.51GVFGEE43 pKa = 4.81STTQSDD49 pKa = 4.14FNLKK53 pKa = 10.43DD54 pKa = 3.5EE55 pKa = 4.39QQGSFFVAVEE65 pKa = 4.21HH66 pKa = 6.58PLPFLPNVKK75 pKa = 9.68LAHH78 pKa = 6.44TSLDD82 pKa = 3.41TDD84 pKa = 3.89GNTTLTTDD92 pKa = 4.97FEE94 pKa = 5.41FNDD97 pKa = 3.43QTFTANTSVDD107 pKa = 3.16AVFDD111 pKa = 3.58VSYY114 pKa = 11.56NDD116 pKa = 3.1YY117 pKa = 9.33TFYY120 pKa = 11.65YY121 pKa = 10.52EE122 pKa = 6.06LFDD125 pKa = 4.85NDD127 pKa = 5.06LLTFDD132 pKa = 5.03FGLTARR138 pKa = 11.84DD139 pKa = 3.03LDD141 pKa = 4.07GDD143 pKa = 4.15VKK145 pKa = 11.26VADD148 pKa = 3.84TGNTQSASRR157 pKa = 11.84SVSEE161 pKa = 4.33IVPMVYY167 pKa = 10.15SSAIIGLPFTDD178 pKa = 2.86WNLFAEE184 pKa = 4.85GNYY187 pKa = 8.95LTFDD191 pKa = 3.28DD192 pKa = 4.47HH193 pKa = 6.81TLYY196 pKa = 10.64DD197 pKa = 3.84YY198 pKa = 11.25QVGVSYY204 pKa = 11.46ALTEE208 pKa = 4.04NFALDD213 pKa = 3.59VNLTAGYY220 pKa = 9.64RR221 pKa = 11.84AVKK224 pKa = 10.55FEE226 pKa = 5.95LDD228 pKa = 4.12DD229 pKa = 5.79LDD231 pKa = 5.78DD232 pKa = 5.3FYY234 pKa = 12.12ADD236 pKa = 4.74LEE238 pKa = 4.58FKK240 pKa = 10.98GLFAGVIMHH249 pKa = 7.02FF250 pKa = 3.97
MM1 pKa = 7.37KK2 pKa = 9.96KK3 pKa = 10.28AAIALTLTTLLSASVQADD21 pKa = 3.71TLLGVYY27 pKa = 10.51FGGQVWDD34 pKa = 4.14NEE36 pKa = 4.31AEE38 pKa = 4.51GVFGEE43 pKa = 4.81STTQSDD49 pKa = 4.14FNLKK53 pKa = 10.43DD54 pKa = 3.5EE55 pKa = 4.39QQGSFFVAVEE65 pKa = 4.21HH66 pKa = 6.58PLPFLPNVKK75 pKa = 9.68LAHH78 pKa = 6.44TSLDD82 pKa = 3.41TDD84 pKa = 3.89GNTTLTTDD92 pKa = 4.97FEE94 pKa = 5.41FNDD97 pKa = 3.43QTFTANTSVDD107 pKa = 3.16AVFDD111 pKa = 3.58VSYY114 pKa = 11.56NDD116 pKa = 3.1YY117 pKa = 9.33TFYY120 pKa = 11.65YY121 pKa = 10.52EE122 pKa = 6.06LFDD125 pKa = 4.85NDD127 pKa = 5.06LLTFDD132 pKa = 5.03FGLTARR138 pKa = 11.84DD139 pKa = 3.03LDD141 pKa = 4.07GDD143 pKa = 4.15VKK145 pKa = 11.26VADD148 pKa = 3.84TGNTQSASRR157 pKa = 11.84SVSEE161 pKa = 4.33IVPMVYY167 pKa = 10.15SSAIIGLPFTDD178 pKa = 2.86WNLFAEE184 pKa = 4.85GNYY187 pKa = 8.95LTFDD191 pKa = 3.28DD192 pKa = 4.47HH193 pKa = 6.81TLYY196 pKa = 10.64DD197 pKa = 3.84YY198 pKa = 11.25QVGVSYY204 pKa = 11.46ALTEE208 pKa = 4.04NFALDD213 pKa = 3.59VNLTAGYY220 pKa = 9.64RR221 pKa = 11.84AVKK224 pKa = 10.55FEE226 pKa = 5.95LDD228 pKa = 4.12DD229 pKa = 5.79LDD231 pKa = 5.78DD232 pKa = 5.3FYY234 pKa = 12.12ADD236 pKa = 4.74LEE238 pKa = 4.58FKK240 pKa = 10.98GLFAGVIMHH249 pKa = 7.02FF250 pKa = 3.97
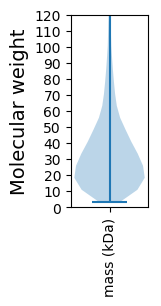
Molecular weight: 27.76 kDa
Isoelectric point according different methods:
Protein with the highest isoelectric point:
>tr|A0A0D8D185|A0A0D8D185_9GAMM TetR family transcriptional regulator OS=Thalassomonas actiniarum OX=485447 GN=SG35_06110 PE=4 SV=1
MM1 pKa = 7.72RR2 pKa = 11.84RR3 pKa = 11.84QKK5 pKa = 10.54RR6 pKa = 11.84DD7 pKa = 2.99RR8 pKa = 11.84LGRR11 pKa = 11.84AFSNGYY17 pKa = 8.44QAGLLGRR24 pKa = 11.84NKK26 pKa = 9.98EE27 pKa = 3.92NCPYY31 pKa = 10.91QNTNAKK37 pKa = 10.06SEE39 pKa = 4.12WLGGWRR45 pKa = 11.84EE46 pKa = 3.85AMTDD50 pKa = 3.28RR51 pKa = 11.84NTGLFKK57 pKa = 10.98
MM1 pKa = 7.72RR2 pKa = 11.84RR3 pKa = 11.84QKK5 pKa = 10.54RR6 pKa = 11.84DD7 pKa = 2.99RR8 pKa = 11.84LGRR11 pKa = 11.84AFSNGYY17 pKa = 8.44QAGLLGRR24 pKa = 11.84NKK26 pKa = 9.98EE27 pKa = 3.92NCPYY31 pKa = 10.91QNTNAKK37 pKa = 10.06SEE39 pKa = 4.12WLGGWRR45 pKa = 11.84EE46 pKa = 3.85AMTDD50 pKa = 3.28RR51 pKa = 11.84NTGLFKK57 pKa = 10.98
Molecular weight: 6.65 kDa
Isoelectric point according different methods:
Peptides (in silico digests for buttom-up proteomics)
Below you can find in silico digests of the whole proteome with Trypsin, Chymotrypsin, Trypsin+LysC, LysN, ArgC proteases suitable for different mass spec machines.| Try ESI |
 |
|---|
| ChTry ESI |
 |
|---|
| ArgC ESI |
 |
|---|
| LysN ESI |
 |
|---|
| TryLysC ESI |
 |
|---|
| Try MALDI |
 |
|---|
| ChTry MALDI |
 |
|---|
| ArgC MALDI |
 |
|---|
| LysN MALDI |
 |
|---|
| TryLysC MALDI |
 |
|---|
| Try LTQ |
 |
|---|
| ChTry LTQ |
 |
|---|
| ArgC LTQ |
 |
|---|
| LysN LTQ |
 |
|---|
| TryLysC LTQ |
 |
|---|
| Try MSlow |
 |
|---|
| ChTry MSlow |
 |
|---|
| ArgC MSlow |
 |
|---|
| LysN MSlow |
 |
|---|
| TryLysC MSlow |
 |
|---|
| Try MShigh |
 |
|---|
| ChTry MShigh |
 |
|---|
| ArgC MShigh |
 |
|---|
| LysN MShigh |
 |
|---|
| TryLysC MShigh |
 |
|---|
General Statistics
Number of major isoforms |
Number of additional isoforms |
Number of all proteins |
Number of amino acids |
Min. Seq. Length |
Max. Seq. Length |
Avg. Seq. Length |
Avg. Mol. Weight |
|---|---|---|---|---|---|---|---|
0 |
1788439 |
31 |
7334 |
327.6 |
36.37 |
Amino acid frequency
Ala |
Cys |
Asp |
Glu |
Phe |
Gly |
His |
Ile |
Lys |
Leu |
|---|---|---|---|---|---|---|---|---|---|
8.751 ± 0.033 | 0.991 ± 0.013 |
5.655 ± 0.03 | 6.025 ± 0.032 |
4.232 ± 0.026 | 6.849 ± 0.041 |
2.168 ± 0.02 | 6.204 ± 0.028 |
5.428 ± 0.039 | 10.693 ± 0.048 |
Met |
Asn |
Gln |
Pro |
Arg |
Ser |
Thr |
Val |
Trp |
Tyr |
|---|---|---|---|---|---|---|---|---|---|
2.314 ± 0.017 | 4.564 ± 0.035 |
3.81 ± 0.023 | 5.052 ± 0.036 |
4.276 ± 0.025 | 6.862 ± 0.036 |
5.281 ± 0.033 | 6.424 ± 0.03 |
1.176 ± 0.014 | 3.243 ± 0.025 |
Most of the basic statistics you can see at this page can be downloaded from this CSV file
Proteome-pI is available under Creative Commons Attribution-NoDerivs license, for more details see here
| Reference: Kozlowski LP. Proteome-pI 2.0: Proteome Isoelectric Point Database Update. Nucleic Acids Res. 2021, doi: 10.1093/nar/gkab944 | Contact: Lukasz P. Kozlowski |
