Sphingomonas sp. Root720
Taxonomy: cellular organisms; Bacteria; Proteobacteria; Alphaproteobacteria; Sphingomonadales; Sphingomonadaceae; Sphingomonas; unclassified Sphingomonas
Average proteome isoelectric point is 6.48
Get precalculated fractions of proteins

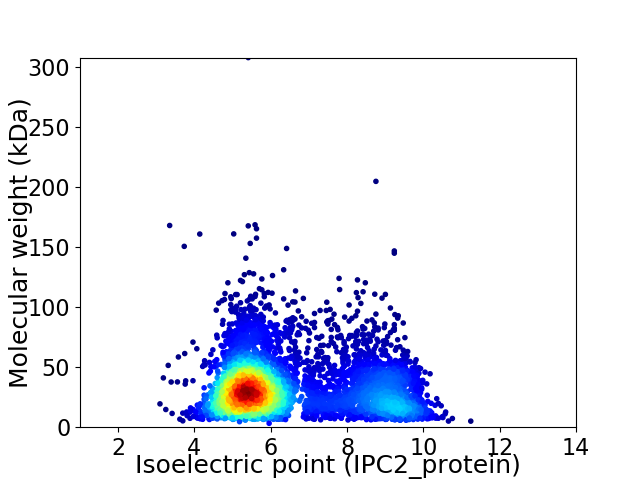
Virtual 2D-PAGE plot for 5044 proteins (isoelectric point calculated using IPC2_protein)
Get csv file with sequences according to given criteria:
* You can choose from 21 different methods for calculating isoelectric point
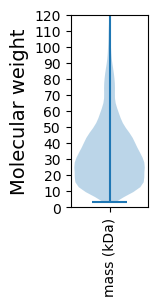
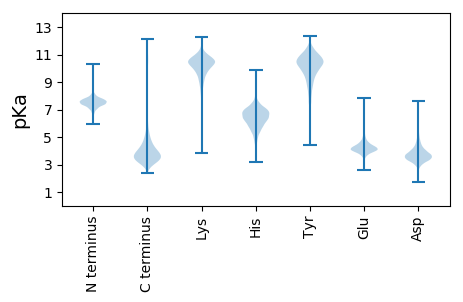
Summary statistics related to proteome-wise predictions


Protein with the lowest isoelectric point:
>tr|A0A0Q8R3A1|A0A0Q8R3A1_9SPHN Peptidase M28 OS=Sphingomonas sp. Root720 OX=1736595 GN=ASE22_14830 PE=4 SV=1
MM1 pKa = 8.78VMVTPVGDD9 pKa = 3.6APVYY13 pKa = 9.71MGSLFDD19 pKa = 4.43FVAVKK24 pKa = 9.59PRR26 pKa = 11.84PEE28 pKa = 4.94AIHH31 pKa = 5.91VQTTTSWIFDD41 pKa = 3.82DD42 pKa = 3.66QVGRR46 pKa = 11.84SSYY49 pKa = 10.97SGIGFTYY56 pKa = 10.14DD57 pKa = 3.09AQGLLVSGTITGLHH71 pKa = 6.06WSAPVYY77 pKa = 10.6GAFDD81 pKa = 3.49VGGLAISAAAFRR93 pKa = 11.84QSWAGGDD100 pKa = 3.67PLAALLPGDD109 pKa = 4.83DD110 pKa = 4.19VYY112 pKa = 11.31QGSSHH117 pKa = 7.48DD118 pKa = 4.28DD119 pKa = 3.43IIRR122 pKa = 11.84DD123 pKa = 3.75VAGHH127 pKa = 5.72NVFLGGDD134 pKa = 3.78GFDD137 pKa = 3.84QMSGGPGNDD146 pKa = 3.75HH147 pKa = 7.22LWGQSPNGGPDD158 pKa = 2.98EE159 pKa = 4.5GDD161 pKa = 3.51YY162 pKa = 11.27LAGGGGSDD170 pKa = 4.27YY171 pKa = 11.13IQGNAGDD178 pKa = 4.6DD179 pKa = 3.81LVEE182 pKa = 5.51GGDD185 pKa = 3.94GSDD188 pKa = 3.59RR189 pKa = 11.84LYY191 pKa = 11.23GGQGEE196 pKa = 4.26DD197 pKa = 3.64ALYY200 pKa = 10.61GGPGNDD206 pKa = 4.01TINGNLGNDD215 pKa = 3.95YY216 pKa = 10.92IQGNEE221 pKa = 4.06GNDD224 pKa = 3.88LLRR227 pKa = 11.84GGQGDD232 pKa = 4.63DD233 pKa = 3.13GWISGGEE240 pKa = 4.16GNDD243 pKa = 3.68TIMGDD248 pKa = 3.91LGADD252 pKa = 3.2RR253 pKa = 11.84MFGGWDD259 pKa = 3.06ADD261 pKa = 3.65LFVFGPGTSPIGATIDD277 pKa = 3.52SVADD281 pKa = 4.01FEE283 pKa = 4.75QGSDD287 pKa = 3.95LISLGFVPATVLTGSSAAAAASIDD311 pKa = 3.67AARR314 pKa = 11.84TAAQALFDD322 pKa = 3.93GHH324 pKa = 8.03AGDD327 pKa = 5.15HH328 pKa = 5.65EE329 pKa = 4.53VAAIGYY335 pKa = 9.09QGATLIFWSGNGGAAIDD352 pKa = 4.11SVVSFQNQSPTDD364 pKa = 3.6FALADD369 pKa = 4.25FGG371 pKa = 4.7
MM1 pKa = 8.78VMVTPVGDD9 pKa = 3.6APVYY13 pKa = 9.71MGSLFDD19 pKa = 4.43FVAVKK24 pKa = 9.59PRR26 pKa = 11.84PEE28 pKa = 4.94AIHH31 pKa = 5.91VQTTTSWIFDD41 pKa = 3.82DD42 pKa = 3.66QVGRR46 pKa = 11.84SSYY49 pKa = 10.97SGIGFTYY56 pKa = 10.14DD57 pKa = 3.09AQGLLVSGTITGLHH71 pKa = 6.06WSAPVYY77 pKa = 10.6GAFDD81 pKa = 3.49VGGLAISAAAFRR93 pKa = 11.84QSWAGGDD100 pKa = 3.67PLAALLPGDD109 pKa = 4.83DD110 pKa = 4.19VYY112 pKa = 11.31QGSSHH117 pKa = 7.48DD118 pKa = 4.28DD119 pKa = 3.43IIRR122 pKa = 11.84DD123 pKa = 3.75VAGHH127 pKa = 5.72NVFLGGDD134 pKa = 3.78GFDD137 pKa = 3.84QMSGGPGNDD146 pKa = 3.75HH147 pKa = 7.22LWGQSPNGGPDD158 pKa = 2.98EE159 pKa = 4.5GDD161 pKa = 3.51YY162 pKa = 11.27LAGGGGSDD170 pKa = 4.27YY171 pKa = 11.13IQGNAGDD178 pKa = 4.6DD179 pKa = 3.81LVEE182 pKa = 5.51GGDD185 pKa = 3.94GSDD188 pKa = 3.59RR189 pKa = 11.84LYY191 pKa = 11.23GGQGEE196 pKa = 4.26DD197 pKa = 3.64ALYY200 pKa = 10.61GGPGNDD206 pKa = 4.01TINGNLGNDD215 pKa = 3.95YY216 pKa = 10.92IQGNEE221 pKa = 4.06GNDD224 pKa = 3.88LLRR227 pKa = 11.84GGQGDD232 pKa = 4.63DD233 pKa = 3.13GWISGGEE240 pKa = 4.16GNDD243 pKa = 3.68TIMGDD248 pKa = 3.91LGADD252 pKa = 3.2RR253 pKa = 11.84MFGGWDD259 pKa = 3.06ADD261 pKa = 3.65LFVFGPGTSPIGATIDD277 pKa = 3.52SVADD281 pKa = 4.01FEE283 pKa = 4.75QGSDD287 pKa = 3.95LISLGFVPATVLTGSSAAAAASIDD311 pKa = 3.67AARR314 pKa = 11.84TAAQALFDD322 pKa = 3.93GHH324 pKa = 8.03AGDD327 pKa = 5.15HH328 pKa = 5.65EE329 pKa = 4.53VAAIGYY335 pKa = 9.09QGATLIFWSGNGGAAIDD352 pKa = 4.11SVVSFQNQSPTDD364 pKa = 3.6FALADD369 pKa = 4.25FGG371 pKa = 4.7
Molecular weight: 37.71 kDa
Isoelectric point according different methods:
Protein with the highest isoelectric point:
>tr|A0A0Q8R1U6|A0A0Q8R1U6_9SPHN Abhydrolase_3 domain-containing protein OS=Sphingomonas sp. Root720 OX=1736595 GN=ASE22_08575 PE=4 SV=1
MM1 pKa = 7.45KK2 pKa = 9.61RR3 pKa = 11.84TFQPSNLVRR12 pKa = 11.84KK13 pKa = 8.96RR14 pKa = 11.84RR15 pKa = 11.84HH16 pKa = 4.61GFRR19 pKa = 11.84SRR21 pKa = 11.84SATPGGRR28 pKa = 11.84KK29 pKa = 9.04VLAARR34 pKa = 11.84RR35 pKa = 11.84ARR37 pKa = 11.84GRR39 pKa = 11.84KK40 pKa = 9.02KK41 pKa = 10.61LSAA44 pKa = 4.03
MM1 pKa = 7.45KK2 pKa = 9.61RR3 pKa = 11.84TFQPSNLVRR12 pKa = 11.84KK13 pKa = 8.96RR14 pKa = 11.84RR15 pKa = 11.84HH16 pKa = 4.61GFRR19 pKa = 11.84SRR21 pKa = 11.84SATPGGRR28 pKa = 11.84KK29 pKa = 9.04VLAARR34 pKa = 11.84RR35 pKa = 11.84ARR37 pKa = 11.84GRR39 pKa = 11.84KK40 pKa = 9.02KK41 pKa = 10.61LSAA44 pKa = 4.03
Molecular weight: 5.05 kDa
Isoelectric point according different methods:
Peptides (in silico digests for buttom-up proteomics)
Below you can find in silico digests of the whole proteome with Trypsin, Chymotrypsin, Trypsin+LysC, LysN, ArgC proteases suitable for different mass spec machines.| Try ESI |
 |
|---|
| ChTry ESI |
 |
|---|
| ArgC ESI |
 |
|---|
| LysN ESI |
 |
|---|
| TryLysC ESI |
 |
|---|
| Try MALDI |
 |
|---|
| ChTry MALDI |
 |
|---|
| ArgC MALDI |
 |
|---|
| LysN MALDI |
 |
|---|
| TryLysC MALDI |
 |
|---|
| Try LTQ |
 |
|---|
| ChTry LTQ |
 |
|---|
| ArgC LTQ |
 |
|---|
| LysN LTQ |
 |
|---|
| TryLysC LTQ |
 |
|---|
| Try MSlow |
 |
|---|
| ChTry MSlow |
 |
|---|
| ArgC MSlow |
 |
|---|
| LysN MSlow |
 |
|---|
| TryLysC MSlow |
 |
|---|
| Try MShigh |
 |
|---|
| ChTry MShigh |
 |
|---|
| ArgC MShigh |
 |
|---|
| LysN MShigh |
 |
|---|
| TryLysC MShigh |
 |
|---|
General Statistics
Number of major isoforms |
Number of additional isoforms |
Number of all proteins |
Number of amino acids |
Min. Seq. Length |
Max. Seq. Length |
Avg. Seq. Length |
Avg. Mol. Weight |
|---|---|---|---|---|---|---|---|
0 |
1638281 |
29 |
2820 |
324.8 |
35.07 |
Amino acid frequency
Ala |
Cys |
Asp |
Glu |
Phe |
Gly |
His |
Ile |
Lys |
Leu |
|---|---|---|---|---|---|---|---|---|---|
13.389 ± 0.046 | 0.81 ± 0.01 |
6.202 ± 0.027 | 5.231 ± 0.03 |
3.558 ± 0.018 | 9.16 ± 0.033 |
2.07 ± 0.017 | 5.234 ± 0.021 |
2.732 ± 0.027 | 9.877 ± 0.037 |
Met |
Asn |
Gln |
Pro |
Arg |
Ser |
Thr |
Val |
Trp |
Tyr |
|---|---|---|---|---|---|---|---|---|---|
2.423 ± 0.016 | 2.369 ± 0.02 |
5.351 ± 0.025 | 2.905 ± 0.016 |
7.696 ± 0.033 | 5.18 ± 0.024 |
5.049 ± 0.025 | 7.098 ± 0.029 |
1.394 ± 0.015 | 2.269 ± 0.016 |
Most of the basic statistics you can see at this page can be downloaded from this CSV file
Proteome-pI is available under Creative Commons Attribution-NoDerivs license, for more details see here
| Reference: Kozlowski LP. Proteome-pI 2.0: Proteome Isoelectric Point Database Update. Nucleic Acids Res. 2021, doi: 10.1093/nar/gkab944 | Contact: Lukasz P. Kozlowski |
