Human adenovirus D37
Taxonomy: Viruses; Varidnaviria; Bamfordvirae; Preplasmiviricota; Tectiliviricetes; Rowavirales; Adenoviridae; Mastadenovirus; Human mastadenovirus D
Average proteome isoelectric point is 6.88
Get precalculated fractions of proteins

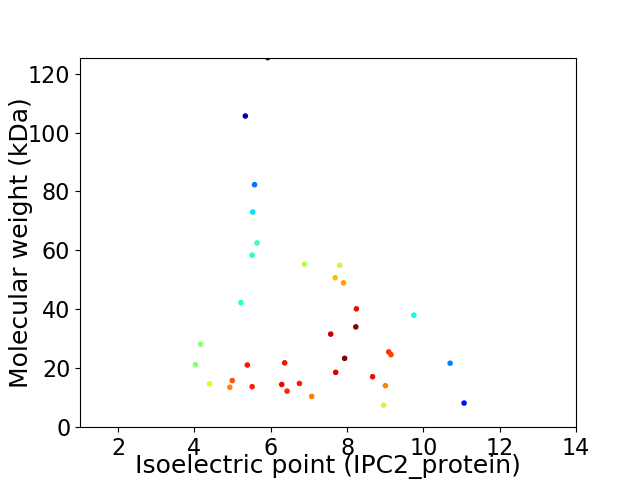
Virtual 2D-PAGE plot for 36 proteins (isoelectric point calculated using IPC2_protein)
Get csv file with sequences according to given criteria:
* You can choose from 21 different methods for calculating isoelectric point
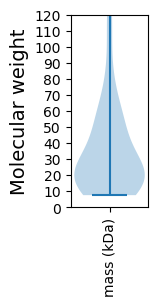
Summary statistics related to proteome-wise predictions


Protein with the lowest isoelectric point:
>tr|B2VQE5|B2VQE5_9ADEN Hexon-interlacing protein OS=Human adenovirus D37 OX=52275 GN=pIX PE=2 SV=1
MM1 pKa = 7.48RR2 pKa = 11.84HH3 pKa = 5.92LRR5 pKa = 11.84LLSSTVPINMAALLLEE21 pKa = 5.34DD22 pKa = 3.96YY23 pKa = 11.04VSTVLEE29 pKa = 4.79DD30 pKa = 3.82EE31 pKa = 4.6LHH33 pKa = 6.57PSPFEE38 pKa = 4.82LGPTLQDD45 pKa = 3.63LYY47 pKa = 11.36DD48 pKa = 4.71LEE50 pKa = 5.3VDD52 pKa = 4.74AHH54 pKa = 7.26DD55 pKa = 5.62DD56 pKa = 3.91DD57 pKa = 5.34PNEE60 pKa = 3.98EE61 pKa = 4.1AVNLIFPEE69 pKa = 4.1SLILQADD76 pKa = 3.89IASEE80 pKa = 4.06AVPTPLHH87 pKa = 6.23TPTLSPIPEE96 pKa = 4.36LEE98 pKa = 4.34EE99 pKa = 4.11EE100 pKa = 4.64DD101 pKa = 4.64EE102 pKa = 4.71LDD104 pKa = 3.55LRR106 pKa = 11.84CYY108 pKa = 10.79EE109 pKa = 4.21EE110 pKa = 5.23GFPPSDD116 pKa = 3.76SEE118 pKa = 5.05DD119 pKa = 3.71EE120 pKa = 4.11QGEE123 pKa = 3.98QSMALISEE131 pKa = 4.56YY132 pKa = 10.4ACVVVEE138 pKa = 3.99EE139 pKa = 5.02HH140 pKa = 6.62FVLDD144 pKa = 3.73NPEE147 pKa = 4.07VPGQGCRR154 pKa = 11.84SCQYY158 pKa = 10.69HH159 pKa = 6.7RR160 pKa = 11.84DD161 pKa = 3.48KK162 pKa = 11.45TGDD165 pKa = 3.55TNASCALCYY174 pKa = 9.23MKK176 pKa = 10.83KK177 pKa = 9.86NFSFIYY183 pKa = 10.29SPVSEE188 pKa = 5.06DD189 pKa = 3.15EE190 pKa = 4.38SSPSEE195 pKa = 4.19EE196 pKa = 4.03NHH198 pKa = 6.28PCPPEE203 pKa = 4.29LSGEE207 pKa = 4.35TPLQVHH213 pKa = 6.61KK214 pKa = 7.82PTPVRR219 pKa = 11.84PSGEE223 pKa = 3.32RR224 pKa = 11.84RR225 pKa = 11.84AAVEE229 pKa = 4.11KK230 pKa = 10.82IEE232 pKa = 5.54DD233 pKa = 4.22LLHH236 pKa = 7.54DD237 pKa = 4.08MGGDD241 pKa = 3.59EE242 pKa = 5.63PLDD245 pKa = 3.88LSLKK249 pKa = 10.14RR250 pKa = 11.84PRR252 pKa = 11.84NN253 pKa = 3.53
MM1 pKa = 7.48RR2 pKa = 11.84HH3 pKa = 5.92LRR5 pKa = 11.84LLSSTVPINMAALLLEE21 pKa = 5.34DD22 pKa = 3.96YY23 pKa = 11.04VSTVLEE29 pKa = 4.79DD30 pKa = 3.82EE31 pKa = 4.6LHH33 pKa = 6.57PSPFEE38 pKa = 4.82LGPTLQDD45 pKa = 3.63LYY47 pKa = 11.36DD48 pKa = 4.71LEE50 pKa = 5.3VDD52 pKa = 4.74AHH54 pKa = 7.26DD55 pKa = 5.62DD56 pKa = 3.91DD57 pKa = 5.34PNEE60 pKa = 3.98EE61 pKa = 4.1AVNLIFPEE69 pKa = 4.1SLILQADD76 pKa = 3.89IASEE80 pKa = 4.06AVPTPLHH87 pKa = 6.23TPTLSPIPEE96 pKa = 4.36LEE98 pKa = 4.34EE99 pKa = 4.11EE100 pKa = 4.64DD101 pKa = 4.64EE102 pKa = 4.71LDD104 pKa = 3.55LRR106 pKa = 11.84CYY108 pKa = 10.79EE109 pKa = 4.21EE110 pKa = 5.23GFPPSDD116 pKa = 3.76SEE118 pKa = 5.05DD119 pKa = 3.71EE120 pKa = 4.11QGEE123 pKa = 3.98QSMALISEE131 pKa = 4.56YY132 pKa = 10.4ACVVVEE138 pKa = 3.99EE139 pKa = 5.02HH140 pKa = 6.62FVLDD144 pKa = 3.73NPEE147 pKa = 4.07VPGQGCRR154 pKa = 11.84SCQYY158 pKa = 10.69HH159 pKa = 6.7RR160 pKa = 11.84DD161 pKa = 3.48KK162 pKa = 11.45TGDD165 pKa = 3.55TNASCALCYY174 pKa = 9.23MKK176 pKa = 10.83KK177 pKa = 9.86NFSFIYY183 pKa = 10.29SPVSEE188 pKa = 5.06DD189 pKa = 3.15EE190 pKa = 4.38SSPSEE195 pKa = 4.19EE196 pKa = 4.03NHH198 pKa = 6.28PCPPEE203 pKa = 4.29LSGEE207 pKa = 4.35TPLQVHH213 pKa = 6.61KK214 pKa = 7.82PTPVRR219 pKa = 11.84PSGEE223 pKa = 3.32RR224 pKa = 11.84RR225 pKa = 11.84AAVEE229 pKa = 4.11KK230 pKa = 10.82IEE232 pKa = 5.54DD233 pKa = 4.22LLHH236 pKa = 7.54DD237 pKa = 4.08MGGDD241 pKa = 3.59EE242 pKa = 5.63PLDD245 pKa = 3.88LSLKK249 pKa = 10.14RR250 pKa = 11.84PRR252 pKa = 11.84NN253 pKa = 3.53
Molecular weight: 28.21 kDa
Isoelectric point according different methods:
Protein with the highest isoelectric point:
>tr|B2VQF5|B2VQF5_9ADEN Isoform of Q3S8A5 Pre-protein VI OS=Human adenovirus D37 OX=52275 GN=L3 PE=2 SV=1
MM1 pKa = 7.77ALTCRR6 pKa = 11.84LRR8 pKa = 11.84IPVPNYY14 pKa = 8.76RR15 pKa = 11.84GRR17 pKa = 11.84SRR19 pKa = 11.84RR20 pKa = 11.84RR21 pKa = 11.84RR22 pKa = 11.84GMAGSGLNRR31 pKa = 11.84RR32 pKa = 11.84RR33 pKa = 11.84RR34 pKa = 11.84RR35 pKa = 11.84AMRR38 pKa = 11.84RR39 pKa = 11.84RR40 pKa = 11.84LSGGFLPALIPIIAAAIGTIPGIASVALQASQRR73 pKa = 11.84RR74 pKa = 3.83
MM1 pKa = 7.77ALTCRR6 pKa = 11.84LRR8 pKa = 11.84IPVPNYY14 pKa = 8.76RR15 pKa = 11.84GRR17 pKa = 11.84SRR19 pKa = 11.84RR20 pKa = 11.84RR21 pKa = 11.84RR22 pKa = 11.84GMAGSGLNRR31 pKa = 11.84RR32 pKa = 11.84RR33 pKa = 11.84RR34 pKa = 11.84RR35 pKa = 11.84AMRR38 pKa = 11.84RR39 pKa = 11.84RR40 pKa = 11.84LSGGFLPALIPIIAAAIGTIPGIASVALQASQRR73 pKa = 11.84RR74 pKa = 3.83
Molecular weight: 8.19 kDa
Isoelectric point according different methods:
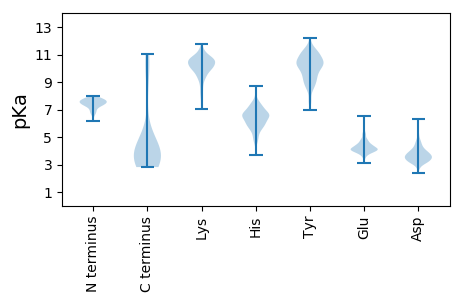
Peptides (in silico digests for buttom-up proteomics)
Below you can find in silico digests of the whole proteome with Trypsin, Chymotrypsin, Trypsin+LysC, LysN, ArgC proteases suitable for different mass spec machines.| Try ESI |
 |
|---|
| ChTry ESI |
 |
|---|
| ArgC ESI |
 |
|---|
| LysN ESI |
 |
|---|
| TryLysC ESI |
 |
|---|
| Try MALDI |
 |
|---|
| ChTry MALDI |
 |
|---|
| ArgC MALDI |
 |
|---|
| LysN MALDI |
 |
|---|
| TryLysC MALDI |
 |
|---|
| Try LTQ |
 |
|---|
| ChTry LTQ |
 |
|---|
| ArgC LTQ |
 |
|---|
| LysN LTQ |
 |
|---|
| TryLysC LTQ |
 |
|---|
| Try MSlow |
 |
|---|
| ChTry MSlow |
 |
|---|
| ArgC MSlow |
 |
|---|
| LysN MSlow |
 |
|---|
| TryLysC MSlow |
 |
|---|
| Try MShigh |
 |
|---|
| ChTry MShigh |
 |
|---|
| ArgC MShigh |
 |
|---|
| LysN MShigh |
 |
|---|
| TryLysC MShigh |
 |
|---|
General Statistics
Number of major isoforms |
Number of additional isoforms |
Number of all proteins |
Number of amino acids |
Min. Seq. Length |
Max. Seq. Length |
Avg. Seq. Length |
Avg. Mol. Weight |
|---|---|---|---|---|---|---|---|
11222 |
65 |
1091 |
311.7 |
35.18 |
Amino acid frequency
Ala |
Cys |
Asp |
Glu |
Phe |
Gly |
His |
Ile |
Lys |
Leu |
|---|---|---|---|---|---|---|---|---|---|
7.129 ± 0.357 | 1.987 ± 0.294 |
5.168 ± 0.333 | 6.363 ± 0.501 |
3.85 ± 0.251 | 6.193 ± 0.287 |
2.62 ± 0.239 | 3.885 ± 0.217 |
4.01 ± 0.381 | 9.562 ± 0.387 |
Met |
Asn |
Gln |
Pro |
Arg |
Ser |
Thr |
Val |
Trp |
Tyr |
|---|---|---|---|---|---|---|---|---|---|
2.736 ± 0.24 | 4.429 ± 0.388 |
6.648 ± 0.356 | 4.331 ± 0.257 |
7.361 ± 0.588 | 6.505 ± 0.321 |
5.944 ± 0.464 | 6.523 ± 0.294 |
1.39 ± 0.117 | 3.368 ± 0.257 |
Most of the basic statistics you can see at this page can be downloaded from this CSV file
Proteome-pI is available under Creative Commons Attribution-NoDerivs license, for more details see here
| Reference: Kozlowski LP. Proteome-pI 2.0: Proteome Isoelectric Point Database Update. Nucleic Acids Res. 2021, doi: 10.1093/nar/gkab944 | Contact: Lukasz P. Kozlowski |
