Paenibacillus nuruki
Taxonomy: cellular organisms; Bacteria; Terrabacteria group; Firmicutes; Bacilli; Bacillales; Paenibacillaceae; Paenibacillus
Average proteome isoelectric point is 6.07
Get precalculated fractions of proteins

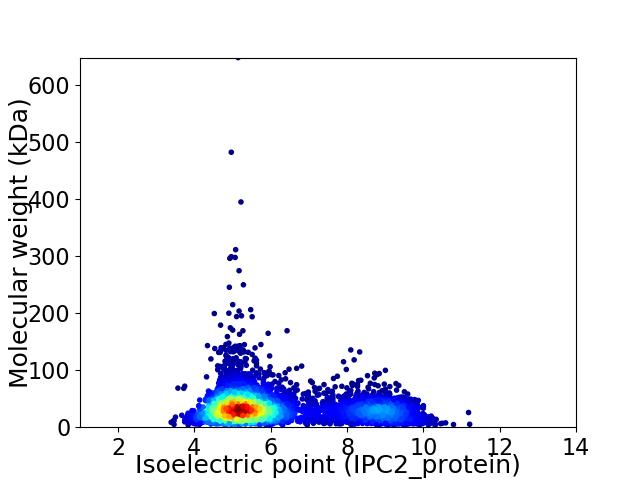
Virtual 2D-PAGE plot for 4645 proteins (isoelectric point calculated using IPC2_protein)
Get csv file with sequences according to given criteria:
* You can choose from 21 different methods for calculating isoelectric point
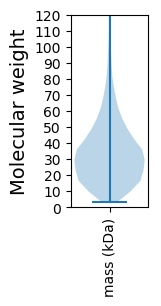
Summary statistics related to proteome-wise predictions


Protein with the lowest isoelectric point:
>tr|A0A1E3L5P2|A0A1E3L5P2_9BACL Carrier domain-containing protein OS=Paenibacillus nuruki OX=1886670 GN=PTI45_01503 PE=4 SV=1
MM1 pKa = 7.14TVSLDD6 pKa = 3.31QLTIQDD12 pKa = 4.08IPWNRR17 pKa = 11.84ITTPYY22 pKa = 10.44GRR24 pKa = 11.84ATEE27 pKa = 4.32VPQMIAKK34 pKa = 10.0RR35 pKa = 11.84NYY37 pKa = 9.22SGLSNIVEE45 pKa = 4.36HH46 pKa = 6.98QSTLWQVTPWLLFFLLKK63 pKa = 10.26EE64 pKa = 4.58LSLQSPDD71 pKa = 3.23EE72 pKa = 4.22VSAAEE77 pKa = 3.75IDD79 pKa = 4.3LYY81 pKa = 11.48AGVIEE86 pKa = 4.64ALSEE90 pKa = 4.07HH91 pKa = 6.28EE92 pKa = 4.03QLEE95 pKa = 4.5DD96 pKa = 3.77TEE98 pKa = 4.43QTLDD102 pKa = 3.75AMPLLLEE109 pKa = 4.27EE110 pKa = 4.55TYY112 pKa = 10.96LWDD115 pKa = 5.54NDD117 pKa = 4.03DD118 pKa = 5.07QDD120 pKa = 6.45DD121 pKa = 3.94EE122 pKa = 5.76LEE124 pKa = 4.18WDD126 pKa = 3.54NEE128 pKa = 3.99EE129 pKa = 3.85PRR131 pKa = 11.84GYY133 pKa = 10.71DD134 pKa = 3.05SEE136 pKa = 5.29IFFNYY141 pKa = 9.46YY142 pKa = 9.34VYY144 pKa = 10.8SYY146 pKa = 11.42LLLKK150 pKa = 10.15QALPIFEE157 pKa = 4.77NISRR161 pKa = 11.84HH162 pKa = 4.5TTDD165 pKa = 4.11QDD167 pKa = 3.62MQNTLQDD174 pKa = 3.35CMEE177 pKa = 4.2YY178 pKa = 11.1LEE180 pKa = 4.53
MM1 pKa = 7.14TVSLDD6 pKa = 3.31QLTIQDD12 pKa = 4.08IPWNRR17 pKa = 11.84ITTPYY22 pKa = 10.44GRR24 pKa = 11.84ATEE27 pKa = 4.32VPQMIAKK34 pKa = 10.0RR35 pKa = 11.84NYY37 pKa = 9.22SGLSNIVEE45 pKa = 4.36HH46 pKa = 6.98QSTLWQVTPWLLFFLLKK63 pKa = 10.26EE64 pKa = 4.58LSLQSPDD71 pKa = 3.23EE72 pKa = 4.22VSAAEE77 pKa = 3.75IDD79 pKa = 4.3LYY81 pKa = 11.48AGVIEE86 pKa = 4.64ALSEE90 pKa = 4.07HH91 pKa = 6.28EE92 pKa = 4.03QLEE95 pKa = 4.5DD96 pKa = 3.77TEE98 pKa = 4.43QTLDD102 pKa = 3.75AMPLLLEE109 pKa = 4.27EE110 pKa = 4.55TYY112 pKa = 10.96LWDD115 pKa = 5.54NDD117 pKa = 4.03DD118 pKa = 5.07QDD120 pKa = 6.45DD121 pKa = 3.94EE122 pKa = 5.76LEE124 pKa = 4.18WDD126 pKa = 3.54NEE128 pKa = 3.99EE129 pKa = 3.85PRR131 pKa = 11.84GYY133 pKa = 10.71DD134 pKa = 3.05SEE136 pKa = 5.29IFFNYY141 pKa = 9.46YY142 pKa = 9.34VYY144 pKa = 10.8SYY146 pKa = 11.42LLLKK150 pKa = 10.15QALPIFEE157 pKa = 4.77NISRR161 pKa = 11.84HH162 pKa = 4.5TTDD165 pKa = 4.11QDD167 pKa = 3.62MQNTLQDD174 pKa = 3.35CMEE177 pKa = 4.2YY178 pKa = 11.1LEE180 pKa = 4.53
Molecular weight: 21.16 kDa
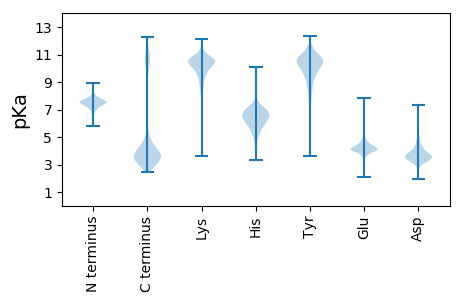
Isoelectric point according different methods:
Protein with the highest isoelectric point:
>tr|A0A1E3L6Q9|A0A1E3L6Q9_9BACL Purine-nucleoside phosphorylase OS=Paenibacillus nuruki OX=1886670 GN=punA PE=4 SV=1
MM1 pKa = 7.82RR2 pKa = 11.84PTFRR6 pKa = 11.84PNVRR10 pKa = 11.84KK11 pKa = 9.69RR12 pKa = 11.84SKK14 pKa = 9.51VHH16 pKa = 5.89GFRR19 pKa = 11.84KK20 pKa = 10.02RR21 pKa = 11.84MSTKK25 pKa = 10.18NGRR28 pKa = 11.84KK29 pKa = 8.87VLAARR34 pKa = 11.84RR35 pKa = 11.84LKK37 pKa = 10.2GRR39 pKa = 11.84KK40 pKa = 8.79VLSAA44 pKa = 4.05
MM1 pKa = 7.82RR2 pKa = 11.84PTFRR6 pKa = 11.84PNVRR10 pKa = 11.84KK11 pKa = 9.69RR12 pKa = 11.84SKK14 pKa = 9.51VHH16 pKa = 5.89GFRR19 pKa = 11.84KK20 pKa = 10.02RR21 pKa = 11.84MSTKK25 pKa = 10.18NGRR28 pKa = 11.84KK29 pKa = 8.87VLAARR34 pKa = 11.84RR35 pKa = 11.84LKK37 pKa = 10.2GRR39 pKa = 11.84KK40 pKa = 8.79VLSAA44 pKa = 4.05
Molecular weight: 5.18 kDa
Isoelectric point according different methods:
Peptides (in silico digests for buttom-up proteomics)
Below you can find in silico digests of the whole proteome with Trypsin, Chymotrypsin, Trypsin+LysC, LysN, ArgC proteases suitable for different mass spec machines.| Try ESI |
 |
|---|
| ChTry ESI |
 |
|---|
| ArgC ESI |
 |
|---|
| LysN ESI |
 |
|---|
| TryLysC ESI |
 |
|---|
| Try MALDI |
 |
|---|
| ChTry MALDI |
 |
|---|
| ArgC MALDI |
 |
|---|
| LysN MALDI |
 |
|---|
| TryLysC MALDI |
 |
|---|
| Try LTQ |
 |
|---|
| ChTry LTQ |
 |
|---|
| ArgC LTQ |
 |
|---|
| LysN LTQ |
 |
|---|
| TryLysC LTQ |
 |
|---|
| Try MSlow |
 |
|---|
| ChTry MSlow |
 |
|---|
| ArgC MSlow |
 |
|---|
| LysN MSlow |
 |
|---|
| TryLysC MSlow |
 |
|---|
| Try MShigh |
 |
|---|
| ChTry MShigh |
 |
|---|
| ArgC MShigh |
 |
|---|
| LysN MShigh |
 |
|---|
| TryLysC MShigh |
 |
|---|
General Statistics
Number of major isoforms |
Number of additional isoforms |
Number of all proteins |
Number of amino acids |
Min. Seq. Length |
Max. Seq. Length |
Avg. Seq. Length |
Avg. Mol. Weight |
|---|---|---|---|---|---|---|---|
0 |
1523825 |
29 |
5777 |
328.1 |
36.71 |
Amino acid frequency
Ala |
Cys |
Asp |
Glu |
Phe |
Gly |
His |
Ile |
Lys |
Leu |
|---|---|---|---|---|---|---|---|---|---|
7.572 ± 0.036 | 0.705 ± 0.011 |
5.285 ± 0.028 | 6.517 ± 0.047 |
3.903 ± 0.029 | 6.708 ± 0.039 |
2.389 ± 0.022 | 7.478 ± 0.035 |
5.224 ± 0.034 | 9.708 ± 0.041 |
Met |
Asn |
Gln |
Pro |
Arg |
Ser |
Thr |
Val |
Trp |
Tyr |
|---|---|---|---|---|---|---|---|---|---|
2.838 ± 0.017 | 4.201 ± 0.03 |
3.872 ± 0.023 | 4.848 ± 0.037 |
4.307 ± 0.031 | 6.621 ± 0.031 |
6.042 ± 0.035 | 6.808 ± 0.028 |
1.248 ± 0.016 | 3.725 ± 0.024 |
Most of the basic statistics you can see at this page can be downloaded from this CSV file
Proteome-pI is available under Creative Commons Attribution-NoDerivs license, for more details see here
| Reference: Kozlowski LP. Proteome-pI 2.0: Proteome Isoelectric Point Database Update. Nucleic Acids Res. 2021, doi: 10.1093/nar/gkab944 | Contact: Lukasz P. Kozlowski |
