Bacillus phage GA-1 (Bacteriophage GA-1)
Taxonomy: Viruses; Duplodnaviria; Heunggongvirae; Uroviricota; Caudoviricetes; Caudovirales; Salasmaviridae; Tatarstanvirinae; Gaunavirus
Average proteome isoelectric point is 6.16
Get precalculated fractions of proteins
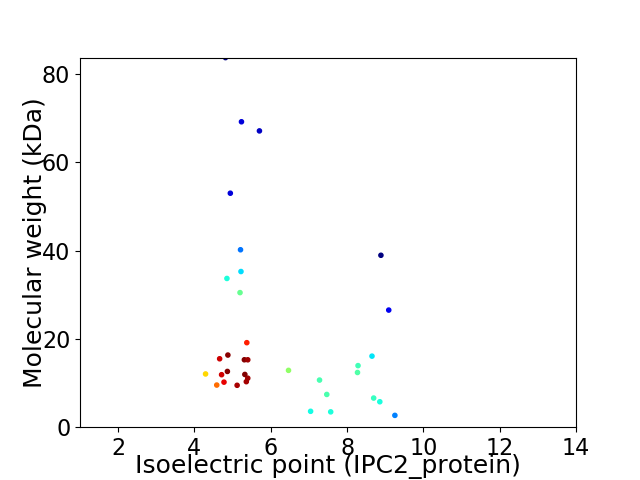
Virtual 2D-PAGE plot for 35 proteins (isoelectric point calculated using IPC2_protein)
Get csv file with sequences according to given criteria:
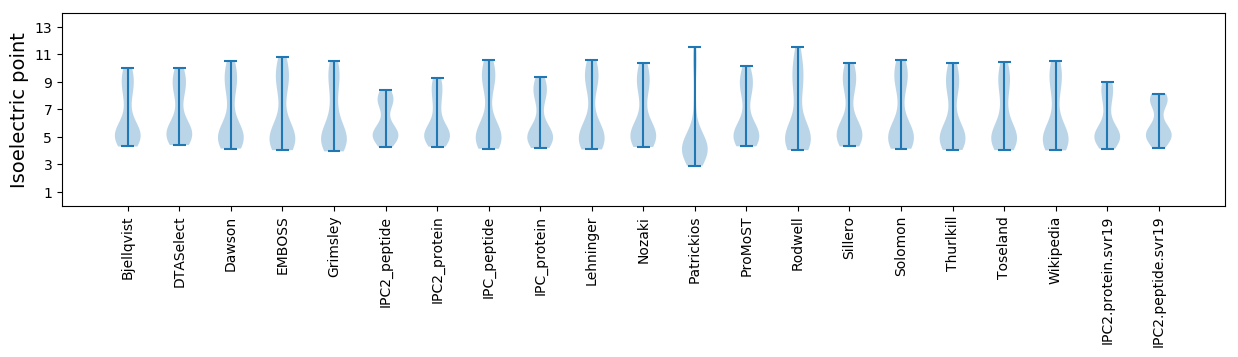
* You can choose from 21 different methods for calculating isoelectric point
Summary statistics related to proteome-wise predictions
Protein with the lowest isoelectric point:
>tr|Q9FZV1|Q9FZV1_BPGA1 Uncharacterized protein OS=Bacillus phage GA-1 OX=12345 PE=4 SV=1
MM1 pKa = 7.14ITMTDD6 pKa = 4.5FISLVEE12 pKa = 4.02EE13 pKa = 3.87NMIYY17 pKa = 10.88ALFEE21 pKa = 4.14LSQPSEE27 pKa = 4.28GIEE30 pKa = 3.89QVIVHH35 pKa = 5.83YY36 pKa = 10.46KK37 pKa = 10.49DD38 pKa = 4.1YY39 pKa = 10.59EE40 pKa = 4.24IPNSHH45 pKa = 6.56YY46 pKa = 11.17YY47 pKa = 10.26KK48 pKa = 10.36IQAQDD53 pKa = 2.62IYY55 pKa = 11.6GEE57 pKa = 4.13LLVTLEE63 pKa = 4.43IFSDD67 pKa = 4.33YY68 pKa = 10.27IDD70 pKa = 4.49RR71 pKa = 11.84PIEE74 pKa = 3.95TVMTSSLEE82 pKa = 3.87EE83 pKa = 3.8TFNIMKK89 pKa = 10.18EE90 pKa = 4.12HH91 pKa = 7.73DD92 pKa = 3.55DD93 pKa = 4.44KK94 pKa = 12.04AWFDD98 pKa = 4.0KK99 pKa = 10.85KK100 pKa = 8.37WW101 pKa = 3.04
MM1 pKa = 7.14ITMTDD6 pKa = 4.5FISLVEE12 pKa = 4.02EE13 pKa = 3.87NMIYY17 pKa = 10.88ALFEE21 pKa = 4.14LSQPSEE27 pKa = 4.28GIEE30 pKa = 3.89QVIVHH35 pKa = 5.83YY36 pKa = 10.46KK37 pKa = 10.49DD38 pKa = 4.1YY39 pKa = 10.59EE40 pKa = 4.24IPNSHH45 pKa = 6.56YY46 pKa = 11.17YY47 pKa = 10.26KK48 pKa = 10.36IQAQDD53 pKa = 2.62IYY55 pKa = 11.6GEE57 pKa = 4.13LLVTLEE63 pKa = 4.43IFSDD67 pKa = 4.33YY68 pKa = 10.27IDD70 pKa = 4.49RR71 pKa = 11.84PIEE74 pKa = 3.95TVMTSSLEE82 pKa = 3.87EE83 pKa = 3.8TFNIMKK89 pKa = 10.18EE90 pKa = 4.12HH91 pKa = 7.73DD92 pKa = 3.55DD93 pKa = 4.44KK94 pKa = 12.04AWFDD98 pKa = 4.0KK99 pKa = 10.85KK100 pKa = 8.37WW101 pKa = 3.04
Molecular weight: 12.07 kDa
Isoelectric point according different methods:
Protein with the highest isoelectric point:
>tr|Q9FZV3|Q9FZV3_BPGA1 Uncharacterized protein OS=Bacillus phage GA-1 OX=12345 PE=4 SV=1
MM1 pKa = 7.35FATTATVIGIFFIGLLVGHH20 pKa = 6.78TLTKK24 pKa = 10.39KK25 pKa = 10.54
MM1 pKa = 7.35FATTATVIGIFFIGLLVGHH20 pKa = 6.78TLTKK24 pKa = 10.39KK25 pKa = 10.54
Molecular weight: 2.68 kDa
Isoelectric point according different methods:
Peptides (in silico digests for buttom-up proteomics)
Below you can find in silico digests of the whole proteome with Trypsin, Chymotrypsin, Trypsin+LysC, LysN, ArgC proteases suitable for different mass spec machines.| Try ESI |
 |
|---|
| ChTry ESI |
|
|---|
| ArgC ESI |
|
|---|
| LysN ESI |
|
|---|
| TryLysC ESI |
|
|---|
| Try MALDI |
|
|---|
| ChTry MALDI |
|
|---|
| ArgC MALDI |
|
|---|
| LysN MALDI |
|
|---|
| TryLysC MALDI |
|
|---|
| Try LTQ |
|
|---|
| ChTry LTQ |
|
|---|
| ArgC LTQ |
|
|---|
| LysN LTQ |
|
|---|
| TryLysC LTQ |
|
|---|
| Try MSlow |
|
|---|
| ChTry MSlow |
|
|---|
| ArgC MSlow |
|
|---|
| LysN MSlow |
|
|---|
| TryLysC MSlow |
|
|---|
| Try MShigh |
|
|---|
| ChTry MShigh |
|
|---|
| ArgC MShigh |
|
|---|
| LysN MShigh |
|
|---|
| TryLysC MShigh |
|
|---|
General Statistics
Number of major isoforms |
Number of additional isoforms |
Number of all proteins |
Number of amino acids |
Min. Seq. Length |
Max. Seq. Length |
Avg. Seq. Length |
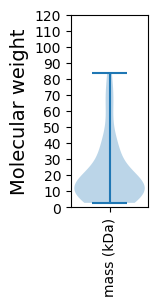
Avg. Mol. Weight |
|---|---|---|---|---|---|---|---|
0 |
6563 |
25 |
740 |
187.5 |
21.56 |
Amino acid frequency
Ala |
Cys |
Asp |
Glu |
Phe |
Gly |
His |
Ile |
Lys |
Leu |
|---|---|---|---|---|---|---|---|---|---|
4.906 ± 0.373 | 0.762 ± 0.172 |
6.552 ± 0.287 | 7.649 ± 0.56 |
5.043 ± 0.42 | 6.019 ± 0.428 |
1.783 ± 0.18 | 7.055 ± 0.434 |
8.152 ± 0.701 | 8.167 ± 0.346 |
Met |
Asn |
Gln |
Pro |
Arg |
Ser |
Thr |
Val |
Trp |
Tyr |
|---|---|---|---|---|---|---|---|---|---|
2.895 ± 0.188 | 6.339 ± 0.381 |
2.712 ± 0.32 | 3.398 ± 0.273 |
3.977 ± 0.289 | 5.592 ± 0.314 |
6.171 ± 0.331 | 6.704 ± 0.35 |
1.204 ± 0.215 | 4.906 ± 0.362 |
Most of the basic statistics you can see at this page can be downloaded from this CSV file
See this proteome in:

Proteome-pI is available under Creative Commons Attribution-NoDerivs license, for more details see here
| Reference: Kozlowski LP. Proteome-pI 2.0: Proteome Isoelectric Point Database Update. Nucleic Acids Res. 2021, doi: 10.1093/nar/gkab944 | Contact: Lukasz P. Kozlowski |