Flavobacterium noncentrifugens
Taxonomy: cellular organisms; Bacteria; FCB group; Bacteroidetes/Chlorobi group; Bacteroidetes; Flavobacteriia; Flavobacteriales; Flavobacteriaceae; Flavobacterium
Average proteome isoelectric point is 6.58
Get precalculated fractions of proteins

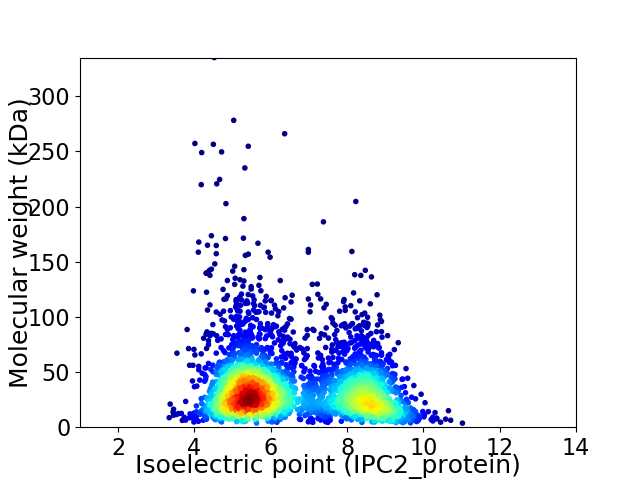
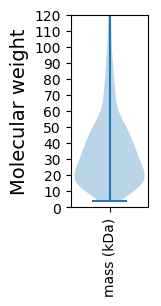
Virtual 2D-PAGE plot for 3558 proteins (isoelectric point calculated using IPC2_protein)
Get csv file with sequences according to given criteria:
* You can choose from 21 different methods for calculating isoelectric point
Summary statistics related to proteome-wise predictions


Protein with the lowest isoelectric point:
>tr|A0A1G8VCF8|A0A1G8VCF8_9FLAO Aquaporin Z OS=Flavobacterium noncentrifugens OX=1128970 GN=SAMN04487935_1286 PE=3 SV=1
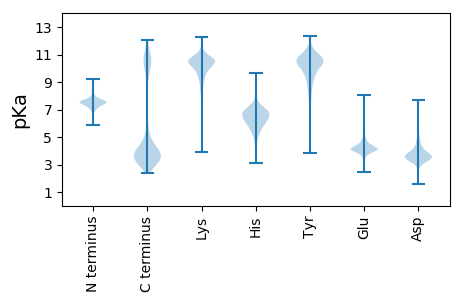
MM1 pKa = 7.54EE2 pKa = 5.29NNYY5 pKa = 9.84LSKK8 pKa = 10.48IISFCPKK15 pKa = 10.41AILLGLLAFSPKK27 pKa = 10.35GIAQSYY33 pKa = 7.12TVTPIPFQVYY43 pKa = 8.05TADD46 pKa = 3.62TQVQGTADD54 pKa = 3.82DD55 pKa = 4.86LYY57 pKa = 11.37SPVITLPFNFTFYY70 pKa = 11.24GNSYY74 pKa = 8.37SQIVISTNGYY84 pKa = 7.64IDD86 pKa = 3.77FRR88 pKa = 11.84IGMTGLMSEE97 pKa = 4.13WDD99 pKa = 4.08LNGLTIPSANFATKK113 pKa = 10.7NSILGAYY120 pKa = 9.33HH121 pKa = 7.53DD122 pKa = 5.36MYY124 pKa = 11.36NSSQDD129 pKa = 3.62PNVGSITMGTFGFAPYY145 pKa = 10.23RR146 pKa = 11.84RR147 pKa = 11.84FIVMFDD153 pKa = 3.5NNSHH157 pKa = 5.98YY158 pKa = 10.97SCQAVKK164 pKa = 10.77SSFQMILYY172 pKa = 7.05EE173 pKa = 4.12TTNIIDD179 pKa = 3.4VQLIDD184 pKa = 4.93KK185 pKa = 7.46PICAGWEE192 pKa = 3.47QGAAVTGIINSTGTEE207 pKa = 3.76AVTPPGRR214 pKa = 11.84NTGAWTAFHH223 pKa = 6.48EE224 pKa = 5.09GWRR227 pKa = 11.84FQDD230 pKa = 4.16LEE232 pKa = 4.09SSTAYY237 pKa = 10.85NYY239 pKa = 7.6TKK241 pKa = 10.69CDD243 pKa = 3.49ANTDD247 pKa = 3.17GFEE250 pKa = 4.03IFNLNVAQNDD260 pKa = 3.67LWPANPSGIHH270 pKa = 6.34FYY272 pKa = 10.97SSEE275 pKa = 3.83TDD277 pKa = 3.52AVSEE281 pKa = 4.3TNALSLNYY289 pKa = 10.22TNTTANEE296 pKa = 3.66QTIYY300 pKa = 10.74TNIGGLVKK308 pKa = 10.29QIILRR313 pKa = 11.84TVDD316 pKa = 3.32CANDD320 pKa = 3.58FDD322 pKa = 6.56ADD324 pKa = 4.09TVASADD330 pKa = 3.6EE331 pKa = 4.61DD332 pKa = 4.29LNHH335 pKa = 7.53DD336 pKa = 4.14GNLANDD342 pKa = 3.93DD343 pKa = 3.96TDD345 pKa = 4.88GDD347 pKa = 4.51GIPNFTDD354 pKa = 3.27NDD356 pKa = 4.1DD357 pKa = 5.25DD358 pKa = 5.92GDD360 pKa = 4.12LVLTNVEE367 pKa = 4.35YY368 pKa = 11.14VFPKK372 pKa = 10.37SGNAVLDD379 pKa = 3.83TDD381 pKa = 3.94SDD383 pKa = 4.59GIPDD387 pKa = 4.22YY388 pKa = 11.51LDD390 pKa = 4.92ADD392 pKa = 4.28DD393 pKa = 6.28DD394 pKa = 5.06GDD396 pKa = 4.18GVLTINEE403 pKa = 4.68DD404 pKa = 3.68YY405 pKa = 11.08NGNHH409 pKa = 6.01NPIDD413 pKa = 5.28DD414 pKa = 4.14DD415 pKa = 3.89TDD417 pKa = 3.94NNGTPDD423 pKa = 3.74YY424 pKa = 10.12LQLGVALGTNGFNIAKK440 pKa = 9.78NSIAIFPNPASDD452 pKa = 3.89VLNIEE457 pKa = 4.39NKK459 pKa = 10.07SSEE462 pKa = 4.48AITNVSVYY470 pKa = 10.3SINGVLVKK478 pKa = 9.95EE479 pKa = 5.08AKK481 pKa = 10.16NAMDD485 pKa = 5.16KK486 pKa = 10.85ISVSDD491 pKa = 3.93LQTGVYY497 pKa = 9.05FVKK500 pKa = 10.45IQAGNQTLNYY510 pKa = 10.15KK511 pKa = 10.04FIKK514 pKa = 9.96KK515 pKa = 9.89
MM1 pKa = 7.54EE2 pKa = 5.29NNYY5 pKa = 9.84LSKK8 pKa = 10.48IISFCPKK15 pKa = 10.41AILLGLLAFSPKK27 pKa = 10.35GIAQSYY33 pKa = 7.12TVTPIPFQVYY43 pKa = 8.05TADD46 pKa = 3.62TQVQGTADD54 pKa = 3.82DD55 pKa = 4.86LYY57 pKa = 11.37SPVITLPFNFTFYY70 pKa = 11.24GNSYY74 pKa = 8.37SQIVISTNGYY84 pKa = 7.64IDD86 pKa = 3.77FRR88 pKa = 11.84IGMTGLMSEE97 pKa = 4.13WDD99 pKa = 4.08LNGLTIPSANFATKK113 pKa = 10.7NSILGAYY120 pKa = 9.33HH121 pKa = 7.53DD122 pKa = 5.36MYY124 pKa = 11.36NSSQDD129 pKa = 3.62PNVGSITMGTFGFAPYY145 pKa = 10.23RR146 pKa = 11.84RR147 pKa = 11.84FIVMFDD153 pKa = 3.5NNSHH157 pKa = 5.98YY158 pKa = 10.97SCQAVKK164 pKa = 10.77SSFQMILYY172 pKa = 7.05EE173 pKa = 4.12TTNIIDD179 pKa = 3.4VQLIDD184 pKa = 4.93KK185 pKa = 7.46PICAGWEE192 pKa = 3.47QGAAVTGIINSTGTEE207 pKa = 3.76AVTPPGRR214 pKa = 11.84NTGAWTAFHH223 pKa = 6.48EE224 pKa = 5.09GWRR227 pKa = 11.84FQDD230 pKa = 4.16LEE232 pKa = 4.09SSTAYY237 pKa = 10.85NYY239 pKa = 7.6TKK241 pKa = 10.69CDD243 pKa = 3.49ANTDD247 pKa = 3.17GFEE250 pKa = 4.03IFNLNVAQNDD260 pKa = 3.67LWPANPSGIHH270 pKa = 6.34FYY272 pKa = 10.97SSEE275 pKa = 3.83TDD277 pKa = 3.52AVSEE281 pKa = 4.3TNALSLNYY289 pKa = 10.22TNTTANEE296 pKa = 3.66QTIYY300 pKa = 10.74TNIGGLVKK308 pKa = 10.29QIILRR313 pKa = 11.84TVDD316 pKa = 3.32CANDD320 pKa = 3.58FDD322 pKa = 6.56ADD324 pKa = 4.09TVASADD330 pKa = 3.6EE331 pKa = 4.61DD332 pKa = 4.29LNHH335 pKa = 7.53DD336 pKa = 4.14GNLANDD342 pKa = 3.93DD343 pKa = 3.96TDD345 pKa = 4.88GDD347 pKa = 4.51GIPNFTDD354 pKa = 3.27NDD356 pKa = 4.1DD357 pKa = 5.25DD358 pKa = 5.92GDD360 pKa = 4.12LVLTNVEE367 pKa = 4.35YY368 pKa = 11.14VFPKK372 pKa = 10.37SGNAVLDD379 pKa = 3.83TDD381 pKa = 3.94SDD383 pKa = 4.59GIPDD387 pKa = 4.22YY388 pKa = 11.51LDD390 pKa = 4.92ADD392 pKa = 4.28DD393 pKa = 6.28DD394 pKa = 5.06GDD396 pKa = 4.18GVLTINEE403 pKa = 4.68DD404 pKa = 3.68YY405 pKa = 11.08NGNHH409 pKa = 6.01NPIDD413 pKa = 5.28DD414 pKa = 4.14DD415 pKa = 3.89TDD417 pKa = 3.94NNGTPDD423 pKa = 3.74YY424 pKa = 10.12LQLGVALGTNGFNIAKK440 pKa = 9.78NSIAIFPNPASDD452 pKa = 3.89VLNIEE457 pKa = 4.39NKK459 pKa = 10.07SSEE462 pKa = 4.48AITNVSVYY470 pKa = 10.3SINGVLVKK478 pKa = 9.95EE479 pKa = 5.08AKK481 pKa = 10.16NAMDD485 pKa = 5.16KK486 pKa = 10.85ISVSDD491 pKa = 3.93LQTGVYY497 pKa = 9.05FVKK500 pKa = 10.45IQAGNQTLNYY510 pKa = 10.15KK511 pKa = 10.04FIKK514 pKa = 9.96KK515 pKa = 9.89
Molecular weight: 56.12 kDa
Isoelectric point according different methods:
Protein with the highest isoelectric point:
>tr|A0A1G8S7U0|A0A1G8S7U0_9FLAO Uncharacterized protein OS=Flavobacterium noncentrifugens OX=1128970 GN=SAMN04487935_0440 PE=4 SV=1
MM1 pKa = 7.84PSGKK5 pKa = 9.32KK6 pKa = 9.59RR7 pKa = 11.84KK8 pKa = 7.05RR9 pKa = 11.84HH10 pKa = 5.11KK11 pKa = 10.59VATHH15 pKa = 5.35KK16 pKa = 10.31RR17 pKa = 11.84KK18 pKa = 9.82KK19 pKa = 8.65RR20 pKa = 11.84ARR22 pKa = 11.84ANRR25 pKa = 11.84HH26 pKa = 4.91KK27 pKa = 10.59KK28 pKa = 9.82KK29 pKa = 10.51KK30 pKa = 10.04
MM1 pKa = 7.84PSGKK5 pKa = 9.32KK6 pKa = 9.59RR7 pKa = 11.84KK8 pKa = 7.05RR9 pKa = 11.84HH10 pKa = 5.11KK11 pKa = 10.59VATHH15 pKa = 5.35KK16 pKa = 10.31RR17 pKa = 11.84KK18 pKa = 9.82KK19 pKa = 8.65RR20 pKa = 11.84ARR22 pKa = 11.84ANRR25 pKa = 11.84HH26 pKa = 4.91KK27 pKa = 10.59KK28 pKa = 9.82KK29 pKa = 10.51KK30 pKa = 10.04
Molecular weight: 3.68 kDa
Isoelectric point according different methods:
Peptides (in silico digests for buttom-up proteomics)
Below you can find in silico digests of the whole proteome with Trypsin, Chymotrypsin, Trypsin+LysC, LysN, ArgC proteases suitable for different mass spec machines.| Try ESI |
 |
|---|
| ChTry ESI |
 |
|---|
| ArgC ESI |
 |
|---|
| LysN ESI |
 |
|---|
| TryLysC ESI |
 |
|---|
| Try MALDI |
 |
|---|
| ChTry MALDI |
 |
|---|
| ArgC MALDI |
 |
|---|
| LysN MALDI |
 |
|---|
| TryLysC MALDI |
 |
|---|
| Try LTQ |
 |
|---|
| ChTry LTQ |
 |
|---|
| ArgC LTQ |
 |
|---|
| LysN LTQ |
 |
|---|
| TryLysC LTQ |
 |
|---|
| Try MSlow |
 |
|---|
| ChTry MSlow |
 |
|---|
| ArgC MSlow |
 |
|---|
| LysN MSlow |
 |
|---|
| TryLysC MSlow |
 |
|---|
| Try MShigh |
 |
|---|
| ChTry MShigh |
 |
|---|
| ArgC MShigh |
 |
|---|
| LysN MShigh |
 |
|---|
| TryLysC MShigh |
 |
|---|
General Statistics
Number of major isoforms |
Number of additional isoforms |
Number of all proteins |
Number of amino acids |
Min. Seq. Length |
Max. Seq. Length |
Avg. Seq. Length |
Avg. Mol. Weight |
|---|---|---|---|---|---|---|---|
0 |
1205208 |
30 |
3285 |
338.7 |
37.96 |
Amino acid frequency
Ala |
Cys |
Asp |
Glu |
Phe |
Gly |
His |
Ile |
Lys |
Leu |
|---|---|---|---|---|---|---|---|---|---|
7.202 ± 0.052 | 0.801 ± 0.016 |
5.374 ± 0.036 | 5.985 ± 0.053 |
5.415 ± 0.04 | 6.501 ± 0.05 |
1.708 ± 0.021 | 7.797 ± 0.041 |
7.47 ± 0.061 | 8.952 ± 0.052 |
Met |
Asn |
Gln |
Pro |
Arg |
Ser |
Thr |
Val |
Trp |
Tyr |
|---|---|---|---|---|---|---|---|---|---|
2.239 ± 0.022 | 6.227 ± 0.042 |
3.57 ± 0.029 | 3.425 ± 0.021 |
3.25 ± 0.027 | 6.653 ± 0.033 |
6.218 ± 0.081 | 6.229 ± 0.033 |
1.023 ± 0.015 | 3.961 ± 0.029 |
Most of the basic statistics you can see at this page can be downloaded from this CSV file
Proteome-pI is available under Creative Commons Attribution-NoDerivs license, for more details see here
| Reference: Kozlowski LP. Proteome-pI 2.0: Proteome Isoelectric Point Database Update. Nucleic Acids Res. 2021, doi: 10.1093/nar/gkab944 | Contact: Lukasz P. Kozlowski |
