Vibrio cholerae serotype O1 (strain ATCC 39315 / El Tor Inaba N16961)
Taxonomy: cellular organisms; Bacteria; Proteobacteria; Gammaproteobacteria; Vibrionales; Vibrionaceae; Vibrio; Vibrio cholerae; Vibrio cholerae O1; Vibrio cholerae O1 biovar El Tor
Average proteome isoelectric point is 6.38
Get precalculated fractions of proteins

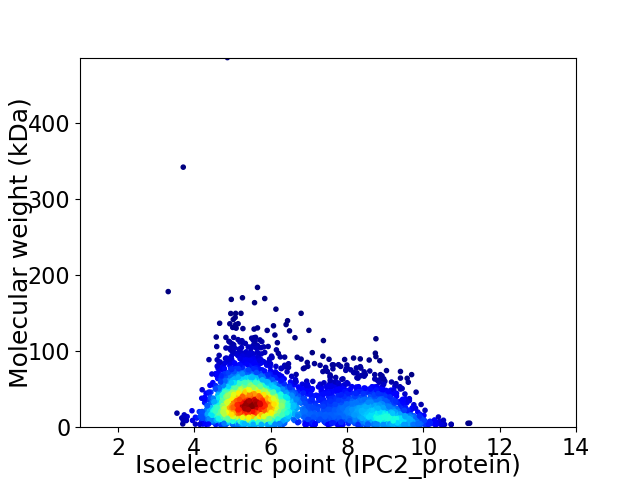
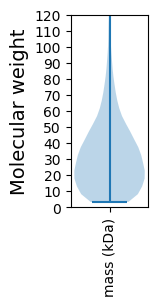
Virtual 2D-PAGE plot for 3782 proteins (isoelectric point calculated using IPC2_protein)
Get csv file with sequences according to given criteria:
* You can choose from 21 different methods for calculating isoelectric point
Summary statistics related to proteome-wise predictions


Protein with the lowest isoelectric point:
>sp|Q9KRA3|FABV1_VIBCH Enoyl-[acyl-carrier-protein] reductase [NADH] 1 OS=Vibrio cholerae serotype O1 (strain ATCC 39315 / El Tor Inaba N16961) OX=243277 GN=fabV PE=1 SV=2
MM1 pKa = 6.75QTLQEE6 pKa = 4.25ILQQPEE12 pKa = 4.61LEE14 pKa = 4.2NKK16 pKa = 9.92LLNQAKK22 pKa = 8.09TVGFVTAMACCPNVLPPEE40 pKa = 4.04EE41 pKa = 4.37WLPFLWGGEE50 pKa = 4.1EE51 pKa = 3.76IAPFSDD57 pKa = 5.12PIQLEE62 pKa = 4.09NYY64 pKa = 8.93FEE66 pKa = 5.21HH67 pKa = 7.91IIALWNEE74 pKa = 3.91TRR76 pKa = 11.84SQLLEE81 pKa = 5.08GNWQWPTGYY90 pKa = 10.65LLDD93 pKa = 3.87EE94 pKa = 4.63AEE96 pKa = 4.32IVNQEE101 pKa = 3.65VRR103 pKa = 11.84DD104 pKa = 4.07FCEE107 pKa = 4.71GMLQGWQLARR117 pKa = 11.84DD118 pKa = 3.88DD119 pKa = 4.58WEE121 pKa = 4.11VLMPEE126 pKa = 4.0NSSDD130 pKa = 3.42NTLLGGVLLSLSMLYY145 pKa = 10.61DD146 pKa = 3.89PEE148 pKa = 4.25TSIATLYY155 pKa = 9.63EE156 pKa = 3.79QGFTGLEE163 pKa = 3.89QFAEE167 pKa = 4.62IYY169 pKa = 10.21HH170 pKa = 7.3AIPVMLCGITQRR182 pKa = 11.84GVTLAEE188 pKa = 4.1AQQ190 pKa = 3.39
MM1 pKa = 6.75QTLQEE6 pKa = 4.25ILQQPEE12 pKa = 4.61LEE14 pKa = 4.2NKK16 pKa = 9.92LLNQAKK22 pKa = 8.09TVGFVTAMACCPNVLPPEE40 pKa = 4.04EE41 pKa = 4.37WLPFLWGGEE50 pKa = 4.1EE51 pKa = 3.76IAPFSDD57 pKa = 5.12PIQLEE62 pKa = 4.09NYY64 pKa = 8.93FEE66 pKa = 5.21HH67 pKa = 7.91IIALWNEE74 pKa = 3.91TRR76 pKa = 11.84SQLLEE81 pKa = 5.08GNWQWPTGYY90 pKa = 10.65LLDD93 pKa = 3.87EE94 pKa = 4.63AEE96 pKa = 4.32IVNQEE101 pKa = 3.65VRR103 pKa = 11.84DD104 pKa = 4.07FCEE107 pKa = 4.71GMLQGWQLARR117 pKa = 11.84DD118 pKa = 3.88DD119 pKa = 4.58WEE121 pKa = 4.11VLMPEE126 pKa = 4.0NSSDD130 pKa = 3.42NTLLGGVLLSLSMLYY145 pKa = 10.61DD146 pKa = 3.89PEE148 pKa = 4.25TSIATLYY155 pKa = 9.63EE156 pKa = 3.79QGFTGLEE163 pKa = 3.89QFAEE167 pKa = 4.62IYY169 pKa = 10.21HH170 pKa = 7.3AIPVMLCGITQRR182 pKa = 11.84GVTLAEE188 pKa = 4.1AQQ190 pKa = 3.39
Molecular weight: 21.58 kDa
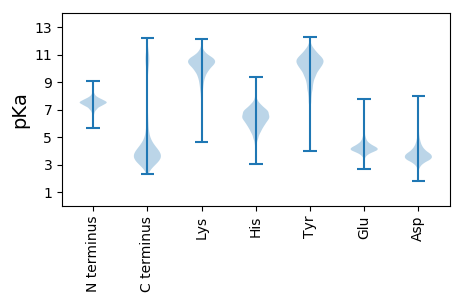
Isoelectric point according different methods:
Protein with the highest isoelectric point:
>sp|Q9KVY2|RNPA_VIBCH Ribonuclease P protein component OS=Vibrio cholerae serotype O1 (strain ATCC 39315 / El Tor Inaba N16961) OX=243277 GN=rnpA PE=3 SV=1
MM1 pKa = 7.69SKK3 pKa = 8.98RR4 pKa = 11.84TFQPSVLKK12 pKa = 10.49RR13 pKa = 11.84KK14 pKa = 7.97RR15 pKa = 11.84THH17 pKa = 5.89GFRR20 pKa = 11.84ARR22 pKa = 11.84MATANGRR29 pKa = 11.84KK30 pKa = 9.15VLNARR35 pKa = 11.84RR36 pKa = 11.84AKK38 pKa = 9.78GRR40 pKa = 11.84KK41 pKa = 8.91RR42 pKa = 11.84LSKK45 pKa = 10.84
MM1 pKa = 7.69SKK3 pKa = 8.98RR4 pKa = 11.84TFQPSVLKK12 pKa = 10.49RR13 pKa = 11.84KK14 pKa = 7.97RR15 pKa = 11.84THH17 pKa = 5.89GFRR20 pKa = 11.84ARR22 pKa = 11.84MATANGRR29 pKa = 11.84KK30 pKa = 9.15VLNARR35 pKa = 11.84RR36 pKa = 11.84AKK38 pKa = 9.78GRR40 pKa = 11.84KK41 pKa = 8.91RR42 pKa = 11.84LSKK45 pKa = 10.84
Molecular weight: 5.25 kDa
Isoelectric point according different methods:
Peptides (in silico digests for buttom-up proteomics)
Below you can find in silico digests of the whole proteome with Trypsin, Chymotrypsin, Trypsin+LysC, LysN, ArgC proteases suitable for different mass spec machines.| Try ESI |
 |
|---|
| ChTry ESI |
 |
|---|
| ArgC ESI |
 |
|---|
| LysN ESI |
 |
|---|
| TryLysC ESI |
 |
|---|
| Try MALDI |
 |
|---|
| ChTry MALDI |
 |
|---|
| ArgC MALDI |
 |
|---|
| LysN MALDI |
 |
|---|
| TryLysC MALDI |
 |
|---|
| Try LTQ |
 |
|---|
| ChTry LTQ |
 |
|---|
| ArgC LTQ |
 |
|---|
| LysN LTQ |
 |
|---|
| TryLysC LTQ |
 |
|---|
| Try MSlow |
 |
|---|
| ChTry MSlow |
 |
|---|
| ArgC MSlow |
 |
|---|
| LysN MSlow |
 |
|---|
| TryLysC MSlow |
 |
|---|
| Try MShigh |
 |
|---|
| ChTry MShigh |
 |
|---|
| ArgC MShigh |
 |
|---|
| LysN MShigh |
 |
|---|
| TryLysC MShigh |
 |
|---|
General Statistics
Number of major isoforms |
Number of additional isoforms |
Number of all proteins |
Number of amino acids |
Min. Seq. Length |
Max. Seq. Length |
Avg. Seq. Length |
Avg. Mol. Weight |
|---|---|---|---|---|---|---|---|
0 |
1153695 |
26 |
4558 |
305.0 |
33.94 |
Amino acid frequency
Ala |
Cys |
Asp |
Glu |
Phe |
Gly |
His |
Ile |
Lys |
Leu |
|---|---|---|---|---|---|---|---|---|---|
9.167 ± 0.045 | 1.048 ± 0.015 |
5.023 ± 0.035 | 6.206 ± 0.041 |
4.071 ± 0.028 | 6.698 ± 0.042 |
2.397 ± 0.024 | 6.045 ± 0.031 |
4.919 ± 0.035 | 10.853 ± 0.05 |
Met |
Asn |
Gln |
Pro |
Arg |
Ser |
Thr |
Val |
Trp |
Tyr |
|---|---|---|---|---|---|---|---|---|---|
2.72 ± 0.02 | 3.898 ± 0.028 |
4.021 ± 0.026 | 5.183 ± 0.038 |
4.934 ± 0.037 | 6.319 ± 0.031 |
5.189 ± 0.026 | 7.033 ± 0.038 |
1.318 ± 0.016 | 2.959 ± 0.024 |
Most of the basic statistics you can see at this page can be downloaded from this CSV file
Proteome-pI is available under Creative Commons Attribution-NoDerivs license, for more details see here
| Reference: Kozlowski LP. Proteome-pI 2.0: Proteome Isoelectric Point Database Update. Nucleic Acids Res. 2021, doi: 10.1093/nar/gkab944 | Contact: Lukasz P. Kozlowski |
