Mycobacterium tuberculosis (strain ATCC 25618 / H37Rv)
Taxonomy: cellular organisms; Bacteria; Terrabacteria group; Actinobacteria; Actinomycetia; Corynebacteriales; Mycobacteriaceae; Mycobacterium; Mycobacterium tuberculosis complex; Mycobacterium tuberculosis
Average proteome isoelectric point is 6.49
Get precalculated fractions of proteins

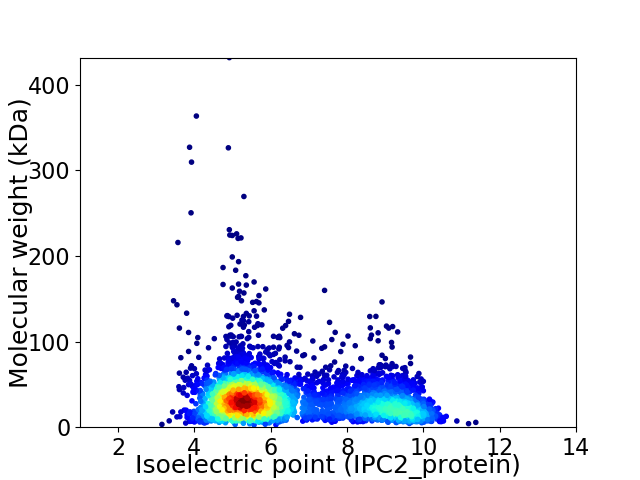
Virtual 2D-PAGE plot for 3997 proteins (isoelectric point calculated using IPC2_protein)
Get csv file with sequences according to given criteria:
* You can choose from 21 different methods for calculating isoelectric point
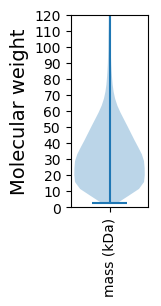
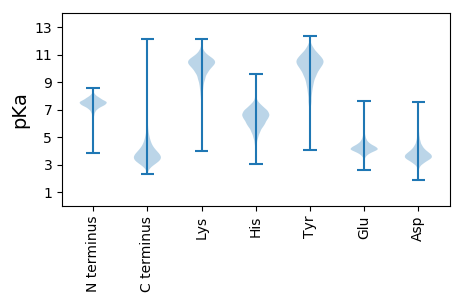
Summary statistics related to proteome-wise predictions


Protein with the lowest isoelectric point:
>sp|P9WIF9|PG20_MYCTU Uncharacterized PE-PGRS family protein PE_PGRS20 OS=Mycobacterium tuberculosis (strain ATCC 25618 / H37Rv) OX=83332 GN=PE_PGRS20 PE=3 SV=1
MM1 pKa = 7.22SFVVAAPEE9 pKa = 4.23VVVAAASDD17 pKa = 3.68LAGIGSAIGAANAAAAVPTMGVLAAGADD45 pKa = 3.78EE46 pKa = 4.59VSAAVADD53 pKa = 4.08LFGAHH58 pKa = 5.81AQAYY62 pKa = 7.57QALSAQAALFHH73 pKa = 6.11EE74 pKa = 4.73QFVHH78 pKa = 7.0AMTAGAGAYY87 pKa = 9.74AGAEE91 pKa = 4.1AADD94 pKa = 3.75AAALDD99 pKa = 4.06VLNGPFQALFGRR111 pKa = 11.84PLIGDD116 pKa = 4.56GANGAPGQPGGPGGLLYY133 pKa = 11.12GNGGNGGNGGIGQPGGAGGDD153 pKa = 3.19AGLIGNGGNGGIGGPGATGLAGGAGGVGGLLFGDD187 pKa = 4.81GGNGGAGGLGTGPVGATGGIGGPGGAAVGLFGHH220 pKa = 6.93GGAGGAGGLGKK231 pKa = 10.5AGFAGGAGGTGGTGGLLYY249 pKa = 11.04GNGGNGGNVPSGAADD264 pKa = 3.84GGAGGDD270 pKa = 3.59ARR272 pKa = 11.84LIGNGGDD279 pKa = 3.64GGSVGAAPTGIGNGGNGGNGGWLYY303 pKa = 11.55GDD305 pKa = 4.35GGSGGSTLQGFSDD318 pKa = 4.35GGTGGNAGMFGDD330 pKa = 4.68GGNGGFSFFDD340 pKa = 3.8GNGGDD345 pKa = 3.87GGTGGTLIGNGGDD358 pKa = 3.67GGNSVQTDD366 pKa = 3.6GFLRR370 pKa = 11.84GHH372 pKa = 6.57GGDD375 pKa = 3.45GGNAVGLIGNGGAGGAGSAGTGVFAPGGGSGGNGGNGALLVGNGGAGGSGGPTQIPSVAVPVTGAGGTGGNGGTAGLIGNGGNGGAAGVSGDD467 pKa = 3.84GTPGTGGNGGYY478 pKa = 10.11AQLIGDD484 pKa = 4.79GGDD487 pKa = 3.6GGPGDD492 pKa = 3.64SGGPGGSGGTGGTLAGQNGSPGGG515 pKa = 3.61
MM1 pKa = 7.22SFVVAAPEE9 pKa = 4.23VVVAAASDD17 pKa = 3.68LAGIGSAIGAANAAAAVPTMGVLAAGADD45 pKa = 3.78EE46 pKa = 4.59VSAAVADD53 pKa = 4.08LFGAHH58 pKa = 5.81AQAYY62 pKa = 7.57QALSAQAALFHH73 pKa = 6.11EE74 pKa = 4.73QFVHH78 pKa = 7.0AMTAGAGAYY87 pKa = 9.74AGAEE91 pKa = 4.1AADD94 pKa = 3.75AAALDD99 pKa = 4.06VLNGPFQALFGRR111 pKa = 11.84PLIGDD116 pKa = 4.56GANGAPGQPGGPGGLLYY133 pKa = 11.12GNGGNGGNGGIGQPGGAGGDD153 pKa = 3.19AGLIGNGGNGGIGGPGATGLAGGAGGVGGLLFGDD187 pKa = 4.81GGNGGAGGLGTGPVGATGGIGGPGGAAVGLFGHH220 pKa = 6.93GGAGGAGGLGKK231 pKa = 10.5AGFAGGAGGTGGTGGLLYY249 pKa = 11.04GNGGNGGNVPSGAADD264 pKa = 3.84GGAGGDD270 pKa = 3.59ARR272 pKa = 11.84LIGNGGDD279 pKa = 3.64GGSVGAAPTGIGNGGNGGNGGWLYY303 pKa = 11.55GDD305 pKa = 4.35GGSGGSTLQGFSDD318 pKa = 4.35GGTGGNAGMFGDD330 pKa = 4.68GGNGGFSFFDD340 pKa = 3.8GNGGDD345 pKa = 3.87GGTGGTLIGNGGDD358 pKa = 3.67GGNSVQTDD366 pKa = 3.6GFLRR370 pKa = 11.84GHH372 pKa = 6.57GGDD375 pKa = 3.45GGNAVGLIGNGGAGGAGSAGTGVFAPGGGSGGNGGNGALLVGNGGAGGSGGPTQIPSVAVPVTGAGGTGGNGGTAGLIGNGGNGGAAGVSGDD467 pKa = 3.84GTPGTGGNGGYY478 pKa = 10.11AQLIGDD484 pKa = 4.79GGDD487 pKa = 3.6GGPGDD492 pKa = 3.64SGGPGGSGGTGGTLAGQNGSPGGG515 pKa = 3.61
Molecular weight: 43.92 kDa
Isoelectric point according different methods:
Protein with the highest isoelectric point:
>sp|P9WHG3|RF1_MYCTU Peptide chain release factor 1 OS=Mycobacterium tuberculosis (strain ATCC 25618 / H37Rv) OX=83332 GN=prfA PE=1 SV=1
MM1 pKa = 7.46TKK3 pKa = 10.27GKK5 pKa = 8.73RR6 pKa = 11.84TFQPNNRR13 pKa = 11.84RR14 pKa = 11.84RR15 pKa = 11.84ARR17 pKa = 11.84VHH19 pKa = 5.99GFRR22 pKa = 11.84LRR24 pKa = 11.84MRR26 pKa = 11.84TRR28 pKa = 11.84AGRR31 pKa = 11.84SIVSSRR37 pKa = 11.84RR38 pKa = 11.84RR39 pKa = 11.84KK40 pKa = 9.56GRR42 pKa = 11.84RR43 pKa = 11.84TLSAA47 pKa = 3.76
MM1 pKa = 7.46TKK3 pKa = 10.27GKK5 pKa = 8.73RR6 pKa = 11.84TFQPNNRR13 pKa = 11.84RR14 pKa = 11.84RR15 pKa = 11.84ARR17 pKa = 11.84VHH19 pKa = 5.99GFRR22 pKa = 11.84LRR24 pKa = 11.84MRR26 pKa = 11.84TRR28 pKa = 11.84AGRR31 pKa = 11.84SIVSSRR37 pKa = 11.84RR38 pKa = 11.84RR39 pKa = 11.84KK40 pKa = 9.56GRR42 pKa = 11.84RR43 pKa = 11.84TLSAA47 pKa = 3.76
Molecular weight: 5.62 kDa
Isoelectric point according different methods:
Peptides (in silico digests for buttom-up proteomics)
Below you can find in silico digests of the whole proteome with Trypsin, Chymotrypsin, Trypsin+LysC, LysN, ArgC proteases suitable for different mass spec machines.| Try ESI |
 |
|---|
| ChTry ESI |
 |
|---|
| ArgC ESI |
 |
|---|
| LysN ESI |
 |
|---|
| TryLysC ESI |
 |
|---|
| Try MALDI |
 |
|---|
| ChTry MALDI |
 |
|---|
| ArgC MALDI |
 |
|---|
| LysN MALDI |
 |
|---|
| TryLysC MALDI |
 |
|---|
| Try LTQ |
 |
|---|
| ChTry LTQ |
 |
|---|
| ArgC LTQ |
 |
|---|
| LysN LTQ |
 |
|---|
| TryLysC LTQ |
 |
|---|
| Try MSlow |
 |
|---|
| ChTry MSlow |
 |
|---|
| ArgC MSlow |
 |
|---|
| LysN MSlow |
 |
|---|
| TryLysC MSlow |
 |
|---|
| Try MShigh |
 |
|---|
| ChTry MShigh |
 |
|---|
| ArgC MShigh |
 |
|---|
| LysN MShigh |
 |
|---|
| TryLysC MShigh |
 |
|---|
General Statistics
Number of major isoforms |
Number of additional isoforms |
Number of all proteins |
Number of amino acids |
Min. Seq. Length |
Max. Seq. Length |
Avg. Seq. Length |
Avg. Mol. Weight |
|---|---|---|---|---|---|---|---|
1332295 |
27 |
4151 |
333.3 |
35.49 |
Amino acid frequency
Ala |
Cys |
Asp |
Glu |
Phe |
Gly |
His |
Ile |
Lys |
Leu |
|---|---|---|---|---|---|---|---|---|---|
13.251 ± 0.067 | 0.887 ± 0.014 |
5.811 ± 0.036 | 4.675 ± 0.044 |
2.958 ± 0.033 | 9.982 ± 0.163 |
2.231 ± 0.018 | 4.265 ± 0.031 |
2.036 ± 0.027 | 9.752 ± 0.046 |
Met |
Asn |
Gln |
Pro |
Arg |
Ser |
Thr |
Val |
Trp |
Tyr |
|---|---|---|---|---|---|---|---|---|---|
1.966 ± 0.019 | 2.534 ± 0.065 |
5.82 ± 0.042 | 3.091 ± 0.023 |
7.312 ± 0.059 | 5.49 ± 0.031 |
5.925 ± 0.033 | 8.476 ± 0.045 |
1.465 ± 0.015 | 2.074 ± 0.02 |
Most of the basic statistics you can see at this page can be downloaded from this CSV file
Proteome-pI is available under Creative Commons Attribution-NoDerivs license, for more details see here
| Reference: Kozlowski LP. Proteome-pI 2.0: Proteome Isoelectric Point Database Update. Nucleic Acids Res. 2021, doi: 10.1093/nar/gkab944 | Contact: Lukasz P. Kozlowski |
