Olsenella sp. KH1P3
Taxonomy: cellular organisms; Bacteria; Terrabacteria group; Actinobacteria; Coriobacteriia; Coriobacteriales; Atopobiaceae; Olsenella; unclassified Olsenella
Average proteome isoelectric point is 5.66
Get precalculated fractions of proteins
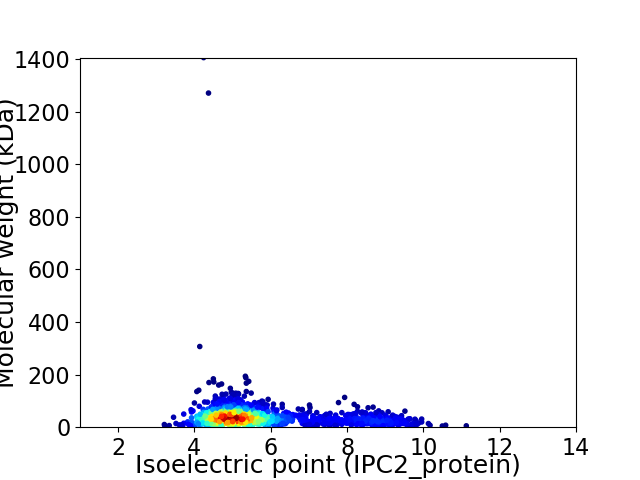
Virtual 2D-PAGE plot for 1609 proteins (isoelectric point calculated using IPC2_protein)
Get csv file with sequences according to given criteria:
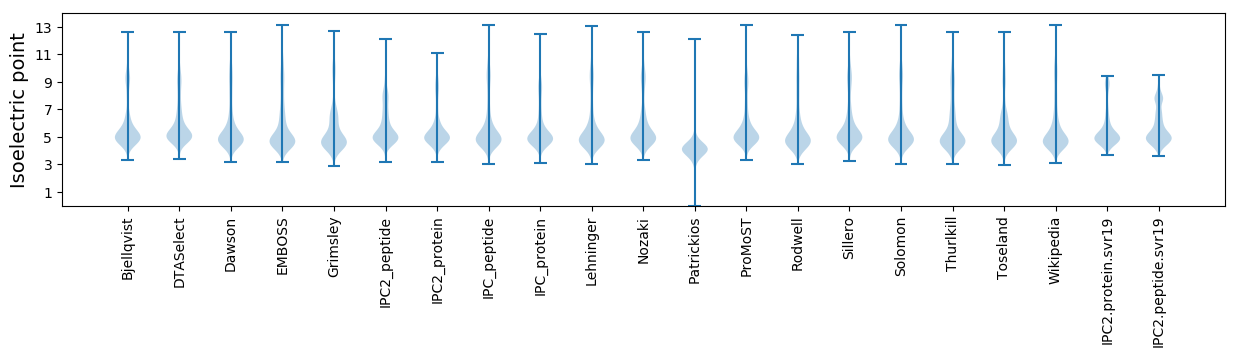
* You can choose from 21 different methods for calculating isoelectric point
Summary statistics related to proteome-wise predictions
Protein with the lowest isoelectric point:
>tr|A0A1T4K3V7|A0A1T4K3V7_9ACTN Zinc transporter ZIP family OS=Olsenella sp. KH1P3 OX=1945884 GN=SAMN06298223_0023 PE=4 SV=1
WW1 pKa = 7.87DD2 pKa = 5.0EE3 pKa = 3.97IGGFQVIYY11 pKa = 10.61EE12 pKa = 4.57EE13 pKa = 5.3NNDD16 pKa = 4.06DD17 pKa = 4.88DD18 pKa = 4.33PTGVDD23 pKa = 4.66VDD25 pKa = 4.53DD26 pKa = 5.3LPNSVVTDD34 pKa = 3.93VKK36 pKa = 10.5WSTSGFDD43 pKa = 3.16TTYY46 pKa = 10.45VSGVAGGPTRR56 pKa = 11.84KK57 pKa = 10.34GYY59 pKa = 10.82DD60 pKa = 3.14FAGWFKK66 pKa = 11.06DD67 pKa = 3.32AGLTNPYY74 pKa = 10.58ASAEE78 pKa = 4.1AYY80 pKa = 9.33KK81 pKa = 10.79DD82 pKa = 3.82LVASTSVTSVTLYY95 pKa = 11.01AKK97 pKa = 9.85WDD99 pKa = 3.87VKK101 pKa = 11.04HH102 pKa = 6.76SDD104 pKa = 2.89AGVDD108 pKa = 3.31YY109 pKa = 10.89KK110 pKa = 11.25VVYY113 pKa = 10.16EE114 pKa = 4.52EE115 pKa = 4.94NNNDD119 pKa = 3.7DD120 pKa = 3.93PSGVDD125 pKa = 4.55VDD127 pKa = 5.03DD128 pKa = 5.17LPNSVVTVVDD138 pKa = 3.8WLTSGLDD145 pKa = 3.28TTFVSGVAGGPTRR158 pKa = 11.84QGYY161 pKa = 9.76AFAGWFKK168 pKa = 11.08DD169 pKa = 3.45AGLTQALASSDD180 pKa = 3.9TYY182 pKa = 11.62GGIAGDD188 pKa = 3.88DD189 pKa = 3.6TVTTVTLYY197 pKa = 11.15AKK199 pKa = 9.6WDD201 pKa = 3.64EE202 pKa = 4.08LADD205 pKa = 4.61FIIHH209 pKa = 6.39YY210 pKa = 9.55DD211 pKa = 3.58VNGGNVATTPADD223 pKa = 3.76RR224 pKa = 11.84TGVAWTDD231 pKa = 3.1VDD233 pKa = 5.09LKK235 pKa = 10.76PATAPTFAGRR245 pKa = 11.84HH246 pKa = 4.71LDD248 pKa = 3.78GYY250 pKa = 9.6GWAYY254 pKa = 10.5RR255 pKa = 11.84DD256 pKa = 3.31AAGNLVAISAATAYY270 pKa = 10.61SEE272 pKa = 4.42AWTLGQGAGKK282 pKa = 10.05EE283 pKa = 4.13VTLYY287 pKa = 11.16ALWADD292 pKa = 3.65NVYY295 pKa = 9.05TLHH298 pKa = 6.57YY299 pKa = 9.85DD300 pKa = 3.63SNGGQYY306 pKa = 11.13ADD308 pKa = 4.21GSTDD312 pKa = 3.27VPVVVKK318 pKa = 10.5WSDD321 pKa = 3.33SGFLTAAPAPTRR333 pKa = 11.84TGYY336 pKa = 9.82VLRR339 pKa = 11.84TTGAWNDD346 pKa = 3.54RR347 pKa = 11.84TDD349 pKa = 3.84GLGTALDD356 pKa = 5.16DD357 pKa = 4.04IMDD360 pKa = 4.02YY361 pKa = 11.27AALAGGNDD369 pKa = 3.62TVLDD373 pKa = 4.19VYY375 pKa = 11.14VYY377 pKa = 10.48AQWDD381 pKa = 4.15PITYY385 pKa = 9.26VVKK388 pKa = 10.76FNSNDD393 pKa = 3.19AAYY396 pKa = 6.93PTAEE400 pKa = 4.15AATGAMADD408 pKa = 3.23QTFTYY413 pKa = 10.24DD414 pKa = 2.92VSQALDD420 pKa = 3.49PNAFARR426 pKa = 11.84RR427 pKa = 11.84GYY429 pKa = 10.9SFAGWNTASDD439 pKa = 4.14GTGIAYY445 pKa = 8.75TDD447 pKa = 3.6AQSVLNLSSTDD458 pKa = 3.15GDD460 pKa = 3.88QIEE463 pKa = 5.6LFAIWDD469 pKa = 3.57
WW1 pKa = 7.87DD2 pKa = 5.0EE3 pKa = 3.97IGGFQVIYY11 pKa = 10.61EE12 pKa = 4.57EE13 pKa = 5.3NNDD16 pKa = 4.06DD17 pKa = 4.88DD18 pKa = 4.33PTGVDD23 pKa = 4.66VDD25 pKa = 4.53DD26 pKa = 5.3LPNSVVTDD34 pKa = 3.93VKK36 pKa = 10.5WSTSGFDD43 pKa = 3.16TTYY46 pKa = 10.45VSGVAGGPTRR56 pKa = 11.84KK57 pKa = 10.34GYY59 pKa = 10.82DD60 pKa = 3.14FAGWFKK66 pKa = 11.06DD67 pKa = 3.32AGLTNPYY74 pKa = 10.58ASAEE78 pKa = 4.1AYY80 pKa = 9.33KK81 pKa = 10.79DD82 pKa = 3.82LVASTSVTSVTLYY95 pKa = 11.01AKK97 pKa = 9.85WDD99 pKa = 3.87VKK101 pKa = 11.04HH102 pKa = 6.76SDD104 pKa = 2.89AGVDD108 pKa = 3.31YY109 pKa = 10.89KK110 pKa = 11.25VVYY113 pKa = 10.16EE114 pKa = 4.52EE115 pKa = 4.94NNNDD119 pKa = 3.7DD120 pKa = 3.93PSGVDD125 pKa = 4.55VDD127 pKa = 5.03DD128 pKa = 5.17LPNSVVTVVDD138 pKa = 3.8WLTSGLDD145 pKa = 3.28TTFVSGVAGGPTRR158 pKa = 11.84QGYY161 pKa = 9.76AFAGWFKK168 pKa = 11.08DD169 pKa = 3.45AGLTQALASSDD180 pKa = 3.9TYY182 pKa = 11.62GGIAGDD188 pKa = 3.88DD189 pKa = 3.6TVTTVTLYY197 pKa = 11.15AKK199 pKa = 9.6WDD201 pKa = 3.64EE202 pKa = 4.08LADD205 pKa = 4.61FIIHH209 pKa = 6.39YY210 pKa = 9.55DD211 pKa = 3.58VNGGNVATTPADD223 pKa = 3.76RR224 pKa = 11.84TGVAWTDD231 pKa = 3.1VDD233 pKa = 5.09LKK235 pKa = 10.76PATAPTFAGRR245 pKa = 11.84HH246 pKa = 4.71LDD248 pKa = 3.78GYY250 pKa = 9.6GWAYY254 pKa = 10.5RR255 pKa = 11.84DD256 pKa = 3.31AAGNLVAISAATAYY270 pKa = 10.61SEE272 pKa = 4.42AWTLGQGAGKK282 pKa = 10.05EE283 pKa = 4.13VTLYY287 pKa = 11.16ALWADD292 pKa = 3.65NVYY295 pKa = 9.05TLHH298 pKa = 6.57YY299 pKa = 9.85DD300 pKa = 3.63SNGGQYY306 pKa = 11.13ADD308 pKa = 4.21GSTDD312 pKa = 3.27VPVVVKK318 pKa = 10.5WSDD321 pKa = 3.33SGFLTAAPAPTRR333 pKa = 11.84TGYY336 pKa = 9.82VLRR339 pKa = 11.84TTGAWNDD346 pKa = 3.54RR347 pKa = 11.84TDD349 pKa = 3.84GLGTALDD356 pKa = 5.16DD357 pKa = 4.04IMDD360 pKa = 4.02YY361 pKa = 11.27AALAGGNDD369 pKa = 3.62TVLDD373 pKa = 4.19VYY375 pKa = 11.14VYY377 pKa = 10.48AQWDD381 pKa = 4.15PITYY385 pKa = 9.26VVKK388 pKa = 10.76FNSNDD393 pKa = 3.19AAYY396 pKa = 6.93PTAEE400 pKa = 4.15AATGAMADD408 pKa = 3.23QTFTYY413 pKa = 10.24DD414 pKa = 2.92VSQALDD420 pKa = 3.49PNAFARR426 pKa = 11.84RR427 pKa = 11.84GYY429 pKa = 10.9SFAGWNTASDD439 pKa = 4.14GTGIAYY445 pKa = 8.75TDD447 pKa = 3.6AQSVLNLSSTDD458 pKa = 3.15GDD460 pKa = 3.88QIEE463 pKa = 5.6LFAIWDD469 pKa = 3.57
Molecular weight: 49.97 kDa
Isoelectric point according different methods:
Protein with the highest isoelectric point:
>tr|A0A1T4MNZ0|A0A1T4MNZ0_9ACTN Ribonuclease P protein component OS=Olsenella sp. KH1P3 OX=1945884 GN=SAMN06298223_1109 PE=4 SV=1
MM1 pKa = 7.35KK2 pKa = 9.42RR3 pKa = 11.84TYY5 pKa = 10.34QPNKK9 pKa = 8.62RR10 pKa = 11.84KK11 pKa = 9.56RR12 pKa = 11.84AKK14 pKa = 8.76THH16 pKa = 5.23GFRR19 pKa = 11.84ARR21 pKa = 11.84MATKK25 pKa = 10.19AGRR28 pKa = 11.84AVLSRR33 pKa = 11.84RR34 pKa = 11.84RR35 pKa = 11.84AKK37 pKa = 9.83GRR39 pKa = 11.84KK40 pKa = 8.88RR41 pKa = 11.84LTVV44 pKa = 3.11
MM1 pKa = 7.35KK2 pKa = 9.42RR3 pKa = 11.84TYY5 pKa = 10.34QPNKK9 pKa = 8.62RR10 pKa = 11.84KK11 pKa = 9.56RR12 pKa = 11.84AKK14 pKa = 8.76THH16 pKa = 5.23GFRR19 pKa = 11.84ARR21 pKa = 11.84MATKK25 pKa = 10.19AGRR28 pKa = 11.84AVLSRR33 pKa = 11.84RR34 pKa = 11.84RR35 pKa = 11.84AKK37 pKa = 9.83GRR39 pKa = 11.84KK40 pKa = 8.88RR41 pKa = 11.84LTVV44 pKa = 3.11
Molecular weight: 5.2 kDa
Isoelectric point according different methods:
Peptides (in silico digests for buttom-up proteomics)
Below you can find in silico digests of the whole proteome with Trypsin, Chymotrypsin, Trypsin+LysC, LysN, ArgC proteases suitable for different mass spec machines.| Try ESI |
 |
|---|
| ChTry ESI |
|
|---|
| ArgC ESI |
|
|---|
| LysN ESI |
|
|---|
| TryLysC ESI |
|
|---|
| Try MALDI |
|
|---|
| ChTry MALDI |
|
|---|
| ArgC MALDI |
|
|---|
| LysN MALDI |
|
|---|
| TryLysC MALDI |
|
|---|
| Try LTQ |
|
|---|
| ChTry LTQ |
|
|---|
| ArgC LTQ |
|
|---|
| LysN LTQ |
|
|---|
| TryLysC LTQ |
|
|---|
| Try MSlow |
|
|---|
| ChTry MSlow |
|
|---|
| ArgC MSlow |
|
|---|
| LysN MSlow |
|
|---|
| TryLysC MSlow |
|
|---|
| Try MShigh |
|
|---|
| ChTry MShigh |
|
|---|
| ArgC MShigh |
|
|---|
| LysN MShigh |
|
|---|
| TryLysC MShigh |
|
|---|
General Statistics
Number of major isoforms |
Number of additional isoforms |
Number of all proteins |
Number of amino acids |
Min. Seq. Length |
Max. Seq. Length |
Avg. Seq. Length |
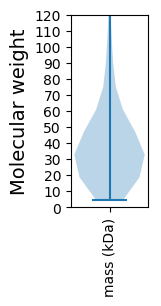
Avg. Mol. Weight |
|---|---|---|---|---|---|---|---|
0 |
595354 |
37 |
13147 |
370.0 |
40.23 |
Amino acid frequency
Ala |
Cys |
Asp |
Glu |
Phe |
Gly |
His |
Ile |
Lys |
Leu |
|---|---|---|---|---|---|---|---|---|---|
10.666 ± 0.098 | 1.481 ± 0.046 |
6.643 ± 0.052 | 6.382 ± 0.119 |
3.535 ± 0.037 | 8.536 ± 0.085 |
1.925 ± 0.029 | 4.792 ± 0.06 |
3.804 ± 0.065 | 9.025 ± 0.093 |
Met |
Asn |
Gln |
Pro |
Arg |
Ser |
Thr |
Val |
Trp |
Tyr |
|---|---|---|---|---|---|---|---|---|---|
2.566 ± 0.036 | 3.009 ± 0.084 |
4.156 ± 0.036 | 2.896 ± 0.041 |
6.053 ± 0.113 | 6.631 ± 0.105 |
5.505 ± 0.176 | 8.374 ± 0.051 |
1.116 ± 0.068 | 2.904 ± 0.071 |
Most of the basic statistics you can see at this page can be downloaded from this CSV file
See this proteome in:

Proteome-pI is available under Creative Commons Attribution-NoDerivs license, for more details see here
| Reference: Kozlowski LP. Proteome-pI 2.0: Proteome Isoelectric Point Database Update. Nucleic Acids Res. 2021, doi: 10.1093/nar/gkab944 | Contact: Lukasz P. Kozlowski |