Glaciecola punicea ACAM 611
Taxonomy: cellular organisms; Bacteria; Proteobacteria; Gammaproteobacteria; Alteromonadales; Alteromonadaceae; Glaciecola; Glaciecola punicea
Average proteome isoelectric point is 6.53
Get precalculated fractions of proteins
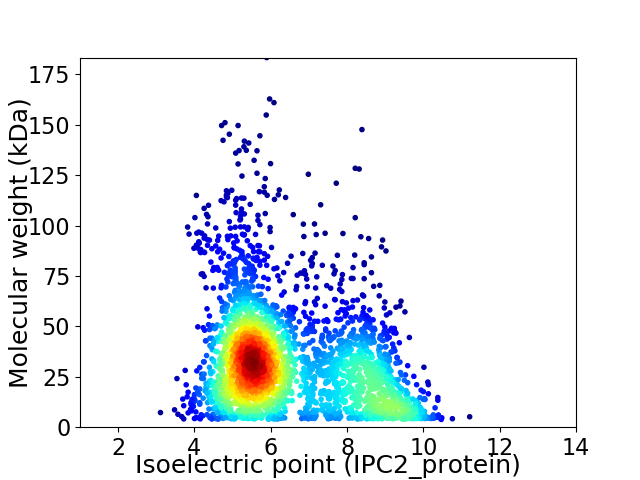
Virtual 2D-PAGE plot for 2883 proteins (isoelectric point calculated using IPC2_protein)
Get csv file with sequences according to given criteria:
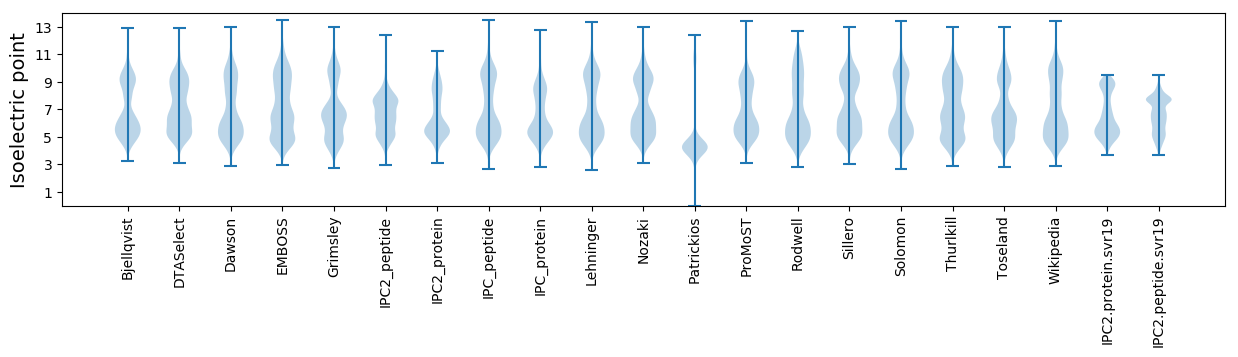
* You can choose from 21 different methods for calculating isoelectric point
Summary statistics related to proteome-wise predictions
Protein with the lowest isoelectric point:
>tr|H5TD77|H5TD77_9ALTE Uncharacterized protein OS=Glaciecola punicea ACAM 611 OX=1121923 GN=GPUN_2139 PE=4 SV=1
MM1 pKa = 7.56TKK3 pKa = 9.83PISIGIFYY11 pKa = 10.69GSTTCYY17 pKa = 10.71TEE19 pKa = 3.84MASEE23 pKa = 5.39KK24 pKa = 10.22IQQQLQALLLQGDD37 pKa = 3.98VVGQVEE43 pKa = 4.74LFDD46 pKa = 4.62IKK48 pKa = 10.55DD49 pKa = 3.22TALAKK54 pKa = 9.82SQNYY58 pKa = 9.68DD59 pKa = 3.36VILYY63 pKa = 9.36GISTWDD69 pKa = 3.39FGEE72 pKa = 4.3LQEE75 pKa = 5.12DD76 pKa = 4.44WEE78 pKa = 4.77STWDD82 pKa = 4.59DD83 pKa = 3.27IATLEE88 pKa = 4.31LSGKK92 pKa = 9.63VVGLFGLGDD101 pKa = 3.54QLGYY105 pKa = 11.22ADD107 pKa = 4.61WFQDD111 pKa = 3.71ALGMLHH117 pKa = 7.55DD118 pKa = 4.59EE119 pKa = 6.1LILLDD124 pKa = 4.83CDD126 pKa = 5.94LIGYY130 pKa = 7.48WPNEE134 pKa = 3.88GYY136 pKa = 10.91EE137 pKa = 4.33FVASKK142 pKa = 11.03GLTPDD147 pKa = 2.99EE148 pKa = 4.11QFFVGLSLDD157 pKa = 4.67DD158 pKa = 3.97EE159 pKa = 4.56NQYY162 pKa = 10.78EE163 pKa = 4.67LSDD166 pKa = 3.53TRR168 pKa = 11.84IKK170 pKa = 10.38LWCKK174 pKa = 9.34QVIDD178 pKa = 5.0QIHH181 pKa = 6.36EE182 pKa = 4.06LNAAA186 pKa = 3.67
MM1 pKa = 7.56TKK3 pKa = 9.83PISIGIFYY11 pKa = 10.69GSTTCYY17 pKa = 10.71TEE19 pKa = 3.84MASEE23 pKa = 5.39KK24 pKa = 10.22IQQQLQALLLQGDD37 pKa = 3.98VVGQVEE43 pKa = 4.74LFDD46 pKa = 4.62IKK48 pKa = 10.55DD49 pKa = 3.22TALAKK54 pKa = 9.82SQNYY58 pKa = 9.68DD59 pKa = 3.36VILYY63 pKa = 9.36GISTWDD69 pKa = 3.39FGEE72 pKa = 4.3LQEE75 pKa = 5.12DD76 pKa = 4.44WEE78 pKa = 4.77STWDD82 pKa = 4.59DD83 pKa = 3.27IATLEE88 pKa = 4.31LSGKK92 pKa = 9.63VVGLFGLGDD101 pKa = 3.54QLGYY105 pKa = 11.22ADD107 pKa = 4.61WFQDD111 pKa = 3.71ALGMLHH117 pKa = 7.55DD118 pKa = 4.59EE119 pKa = 6.1LILLDD124 pKa = 4.83CDD126 pKa = 5.94LIGYY130 pKa = 7.48WPNEE134 pKa = 3.88GYY136 pKa = 10.91EE137 pKa = 4.33FVASKK142 pKa = 11.03GLTPDD147 pKa = 2.99EE148 pKa = 4.11QFFVGLSLDD157 pKa = 4.67DD158 pKa = 3.97EE159 pKa = 4.56NQYY162 pKa = 10.78EE163 pKa = 4.67LSDD166 pKa = 3.53TRR168 pKa = 11.84IKK170 pKa = 10.38LWCKK174 pKa = 9.34QVIDD178 pKa = 5.0QIHH181 pKa = 6.36EE182 pKa = 4.06LNAAA186 pKa = 3.67
Molecular weight: 21.01 kDa
Isoelectric point according different methods:
Protein with the highest isoelectric point:
>tr|H5TDZ7|H5TDZ7_9ALTE Protein adenylyltransferase SelO OS=Glaciecola punicea ACAM 611 OX=1121923 GN=selO PE=3 SV=1
MM1 pKa = 7.45KK2 pKa = 9.61RR3 pKa = 11.84TFQPSNLKK11 pKa = 10.14RR12 pKa = 11.84KK13 pKa = 9.13RR14 pKa = 11.84SHH16 pKa = 6.17GFRR19 pKa = 11.84ARR21 pKa = 11.84MATKK25 pKa = 10.38NGRR28 pKa = 11.84KK29 pKa = 9.48VIANRR34 pKa = 11.84RR35 pKa = 11.84AKK37 pKa = 9.83GRR39 pKa = 11.84KK40 pKa = 8.87RR41 pKa = 11.84LSAA44 pKa = 3.96
MM1 pKa = 7.45KK2 pKa = 9.61RR3 pKa = 11.84TFQPSNLKK11 pKa = 10.14RR12 pKa = 11.84KK13 pKa = 9.13RR14 pKa = 11.84SHH16 pKa = 6.17GFRR19 pKa = 11.84ARR21 pKa = 11.84MATKK25 pKa = 10.38NGRR28 pKa = 11.84KK29 pKa = 9.48VIANRR34 pKa = 11.84RR35 pKa = 11.84AKK37 pKa = 9.83GRR39 pKa = 11.84KK40 pKa = 8.87RR41 pKa = 11.84LSAA44 pKa = 3.96
Molecular weight: 5.17 kDa
Isoelectric point according different methods:
Peptides (in silico digests for buttom-up proteomics)
Below you can find in silico digests of the whole proteome with Trypsin, Chymotrypsin, Trypsin+LysC, LysN, ArgC proteases suitable for different mass spec machines.| Try ESI |
 |
|---|
| ChTry ESI |
|
|---|
| ArgC ESI |
|
|---|
| LysN ESI |
|
|---|
| TryLysC ESI |
|
|---|
| Try MALDI |
|
|---|
| ChTry MALDI |
|
|---|
| ArgC MALDI |
|
|---|
| LysN MALDI |
|
|---|
| TryLysC MALDI |
|
|---|
| Try LTQ |
|
|---|
| ChTry LTQ |
|
|---|
| ArgC LTQ |
|
|---|
| LysN LTQ |
|
|---|
| TryLysC LTQ |
|
|---|
| Try MSlow |
|
|---|
| ChTry MSlow |
|
|---|
| ArgC MSlow |
|
|---|
| LysN MSlow |
|
|---|
| TryLysC MSlow |
|
|---|
| Try MShigh |
|
|---|
| ChTry MShigh |
|
|---|
| ArgC MShigh |
|
|---|
| LysN MShigh |
|
|---|
| TryLysC MShigh |
|
|---|
General Statistics
Number of major isoforms |
Number of additional isoforms |
Number of all proteins |
Number of amino acids |
Min. Seq. Length |
Max. Seq. Length |
Avg. Seq. Length |
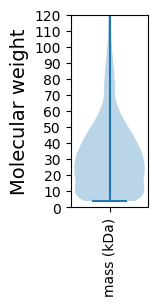
Avg. Mol. Weight |
|---|---|---|---|---|---|---|---|
0 |
882842 |
37 |
1612 |
306.2 |
33.92 |
Amino acid frequency
Ala |
Cys |
Asp |
Glu |
Phe |
Gly |
His |
Ile |
Lys |
Leu |
|---|---|---|---|---|---|---|---|---|---|
8.9 ± 0.043 | 1.043 ± 0.017 |
5.475 ± 0.035 | 5.561 ± 0.042 |
4.337 ± 0.033 | 6.691 ± 0.04 |
2.222 ± 0.023 | 6.904 ± 0.032 |
5.564 ± 0.038 | 10.131 ± 0.054 |
Met |
Asn |
Gln |
Pro |
Arg |
Ser |
Thr |
Val |
Trp |
Tyr |
|---|---|---|---|---|---|---|---|---|---|
2.59 ± 0.023 | 4.69 ± 0.035 |
3.798 ± 0.023 | 4.459 ± 0.035 |
4.338 ± 0.035 | 6.939 ± 0.037 |
5.36 ± 0.027 | 6.883 ± 0.038 |
1.084 ± 0.016 | 3.031 ± 0.026 |
Most of the basic statistics you can see at this page can be downloaded from this CSV file
See this proteome in:

Proteome-pI is available under Creative Commons Attribution-NoDerivs license, for more details see here
| Reference: Kozlowski LP. Proteome-pI 2.0: Proteome Isoelectric Point Database Update. Nucleic Acids Res. 2021, doi: 10.1093/nar/gkab944 | Contact: Lukasz P. Kozlowski |