Sphingomonas rubra
Taxonomy: cellular organisms; Bacteria; Proteobacteria; Alphaproteobacteria; Sphingomonadales; Sphingomonadaceae; Sphingomonas
Average proteome isoelectric point is 6.72
Get precalculated fractions of proteins

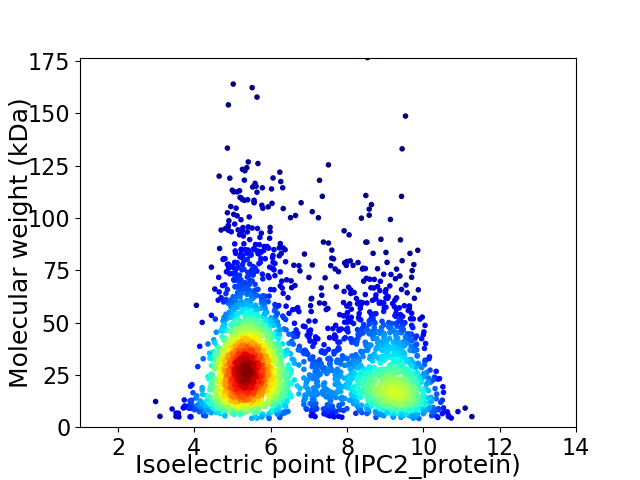
Virtual 2D-PAGE plot for 3070 proteins (isoelectric point calculated using IPC2_protein)
Get csv file with sequences according to given criteria:
* You can choose from 21 different methods for calculating isoelectric point
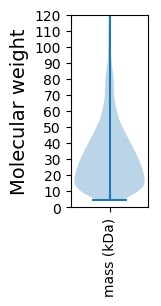
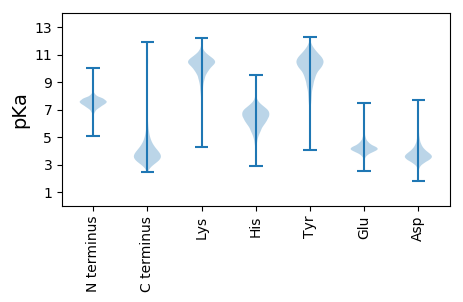
Summary statistics related to proteome-wise predictions


Protein with the lowest isoelectric point:
>tr|A0A1I5U2V0|A0A1I5U2V0_9SPHN Imidazole glycerol phosphate synthase subunit HisF OS=Sphingomonas rubra OX=634430 GN=hisF PE=3 SV=1
MM1 pKa = 7.66RR2 pKa = 11.84LSHH5 pKa = 6.97LLLGGLALAVTTPALAQDD23 pKa = 3.7DD24 pKa = 4.46TAPPKK29 pKa = 10.63AVTVSGSVGLTSDD42 pKa = 3.2YY43 pKa = 10.86RR44 pKa = 11.84FRR46 pKa = 11.84GVSQSDD52 pKa = 3.36EE53 pKa = 3.96NLAVQGGITVSHH65 pKa = 6.76EE66 pKa = 4.07SGVYY70 pKa = 9.83AGVWGSNLAGWGTFGGANMEE90 pKa = 4.45LDD92 pKa = 4.89LIAGVKK98 pKa = 9.99VPVGGGTLDD107 pKa = 4.86VGATWYY113 pKa = 7.91MYY115 pKa = 10.43PGGFDD120 pKa = 2.99NTDD123 pKa = 3.69FIEE126 pKa = 5.02PYY128 pKa = 10.31ARR130 pKa = 11.84LSGTVGPVGLTAGVAYY146 pKa = 10.16APKK149 pKa = 9.91QQALGAWYY157 pKa = 10.55SSGAVAATGVYY168 pKa = 10.31DD169 pKa = 5.8DD170 pKa = 5.67PGDD173 pKa = 4.06KK174 pKa = 10.69NDD176 pKa = 5.24NLYY179 pKa = 11.05LWGDD183 pKa = 3.54VSTAVPDD190 pKa = 3.32TGLTVKK196 pKa = 10.71AHH198 pKa = 6.62LGYY201 pKa = 11.21SNGNKK206 pKa = 10.09GLGPFATSVAPTGEE220 pKa = 4.22YY221 pKa = 10.62VDD223 pKa = 3.72WLAGVDD229 pKa = 3.75YY230 pKa = 8.72TVPGTPLTVGVAYY243 pKa = 10.76VDD245 pKa = 3.56TDD247 pKa = 2.93IDD249 pKa = 3.74RR250 pKa = 11.84AEE252 pKa = 3.94AAYY255 pKa = 9.22LQPSFSRR262 pKa = 11.84GQDD265 pKa = 3.3GVGSIADD272 pKa = 3.51ATVLFTLTAAFF283 pKa = 4.11
MM1 pKa = 7.66RR2 pKa = 11.84LSHH5 pKa = 6.97LLLGGLALAVTTPALAQDD23 pKa = 3.7DD24 pKa = 4.46TAPPKK29 pKa = 10.63AVTVSGSVGLTSDD42 pKa = 3.2YY43 pKa = 10.86RR44 pKa = 11.84FRR46 pKa = 11.84GVSQSDD52 pKa = 3.36EE53 pKa = 3.96NLAVQGGITVSHH65 pKa = 6.76EE66 pKa = 4.07SGVYY70 pKa = 9.83AGVWGSNLAGWGTFGGANMEE90 pKa = 4.45LDD92 pKa = 4.89LIAGVKK98 pKa = 9.99VPVGGGTLDD107 pKa = 4.86VGATWYY113 pKa = 7.91MYY115 pKa = 10.43PGGFDD120 pKa = 2.99NTDD123 pKa = 3.69FIEE126 pKa = 5.02PYY128 pKa = 10.31ARR130 pKa = 11.84LSGTVGPVGLTAGVAYY146 pKa = 10.16APKK149 pKa = 9.91QQALGAWYY157 pKa = 10.55SSGAVAATGVYY168 pKa = 10.31DD169 pKa = 5.8DD170 pKa = 5.67PGDD173 pKa = 4.06KK174 pKa = 10.69NDD176 pKa = 5.24NLYY179 pKa = 11.05LWGDD183 pKa = 3.54VSTAVPDD190 pKa = 3.32TGLTVKK196 pKa = 10.71AHH198 pKa = 6.62LGYY201 pKa = 11.21SNGNKK206 pKa = 10.09GLGPFATSVAPTGEE220 pKa = 4.22YY221 pKa = 10.62VDD223 pKa = 3.72WLAGVDD229 pKa = 3.75YY230 pKa = 8.72TVPGTPLTVGVAYY243 pKa = 10.76VDD245 pKa = 3.56TDD247 pKa = 2.93IDD249 pKa = 3.74RR250 pKa = 11.84AEE252 pKa = 3.94AAYY255 pKa = 9.22LQPSFSRR262 pKa = 11.84GQDD265 pKa = 3.3GVGSIADD272 pKa = 3.51ATVLFTLTAAFF283 pKa = 4.11
Molecular weight: 28.96 kDa
Isoelectric point according different methods:
Protein with the highest isoelectric point:
>tr|A0A1I5QYE4|A0A1I5QYE4_9SPHN Outer membrane receptor proteins mostly Fe transport OS=Sphingomonas rubra OX=634430 GN=SAMN04488241_102383 PE=4 SV=1
MM1 pKa = 7.45KK2 pKa = 9.61RR3 pKa = 11.84TFQPSNLVRR12 pKa = 11.84ARR14 pKa = 11.84RR15 pKa = 11.84HH16 pKa = 4.58GFRR19 pKa = 11.84SRR21 pKa = 11.84MATVGGRR28 pKa = 11.84AVIRR32 pKa = 11.84ARR34 pKa = 11.84RR35 pKa = 11.84ARR37 pKa = 11.84GRR39 pKa = 11.84KK40 pKa = 9.02KK41 pKa = 10.61LSAA44 pKa = 4.03
MM1 pKa = 7.45KK2 pKa = 9.61RR3 pKa = 11.84TFQPSNLVRR12 pKa = 11.84ARR14 pKa = 11.84RR15 pKa = 11.84HH16 pKa = 4.58GFRR19 pKa = 11.84SRR21 pKa = 11.84MATVGGRR28 pKa = 11.84AVIRR32 pKa = 11.84ARR34 pKa = 11.84RR35 pKa = 11.84ARR37 pKa = 11.84GRR39 pKa = 11.84KK40 pKa = 9.02KK41 pKa = 10.61LSAA44 pKa = 4.03
Molecular weight: 5.07 kDa
Isoelectric point according different methods:
Peptides (in silico digests for buttom-up proteomics)
Below you can find in silico digests of the whole proteome with Trypsin, Chymotrypsin, Trypsin+LysC, LysN, ArgC proteases suitable for different mass spec machines.| Try ESI |
 |
|---|
| ChTry ESI |
 |
|---|
| ArgC ESI |
 |
|---|
| LysN ESI |
 |
|---|
| TryLysC ESI |
 |
|---|
| Try MALDI |
 |
|---|
| ChTry MALDI |
 |
|---|
| ArgC MALDI |
 |
|---|
| LysN MALDI |
 |
|---|
| TryLysC MALDI |
 |
|---|
| Try LTQ |
 |
|---|
| ChTry LTQ |
 |
|---|
| ArgC LTQ |
 |
|---|
| LysN LTQ |
 |
|---|
| TryLysC LTQ |
 |
|---|
| Try MSlow |
 |
|---|
| ChTry MSlow |
 |
|---|
| ArgC MSlow |
 |
|---|
| LysN MSlow |
 |
|---|
| TryLysC MSlow |
 |
|---|
| Try MShigh |
 |
|---|
| ChTry MShigh |
 |
|---|
| ArgC MShigh |
 |
|---|
| LysN MShigh |
 |
|---|
| TryLysC MShigh |
 |
|---|
General Statistics
Number of major isoforms |
Number of additional isoforms |
Number of all proteins |
Number of amino acids |
Min. Seq. Length |
Max. Seq. Length |
Avg. Seq. Length |
Avg. Mol. Weight |
|---|---|---|---|---|---|---|---|
0 |
947806 |
39 |
1668 |
308.7 |
33.14 |
Amino acid frequency
Ala |
Cys |
Asp |
Glu |
Phe |
Gly |
His |
Ile |
Lys |
Leu |
|---|---|---|---|---|---|---|---|---|---|
14.506 ± 0.078 | 0.7 ± 0.014 |
6.117 ± 0.038 | 5.112 ± 0.042 |
3.316 ± 0.033 | 9.155 ± 0.039 |
1.933 ± 0.022 | 4.418 ± 0.027 |
2.486 ± 0.037 | 9.865 ± 0.054 |
Met |
Asn |
Gln |
Pro |
Arg |
Ser |
Thr |
Val |
Trp |
Tyr |
|---|---|---|---|---|---|---|---|---|---|
2.248 ± 0.022 | 2.223 ± 0.031 |
5.483 ± 0.034 | 2.911 ± 0.025 |
8.004 ± 0.045 | 4.643 ± 0.029 |
5.583 ± 0.035 | 7.777 ± 0.03 |
1.432 ± 0.019 | 2.087 ± 0.023 |
Most of the basic statistics you can see at this page can be downloaded from this CSV file
Proteome-pI is available under Creative Commons Attribution-NoDerivs license, for more details see here
| Reference: Kozlowski LP. Proteome-pI 2.0: Proteome Isoelectric Point Database Update. Nucleic Acids Res. 2021, doi: 10.1093/nar/gkab944 | Contact: Lukasz P. Kozlowski |
