Luteimicrobium subarcticum
Taxonomy: cellular organisms; Bacteria; Terrabacteria group; Actinobacteria; Actinomycetia; Micrococcales; Micrococcales incertae sedis; Luteimicrobium
Average proteome isoelectric point is 6.09
Get precalculated fractions of proteins

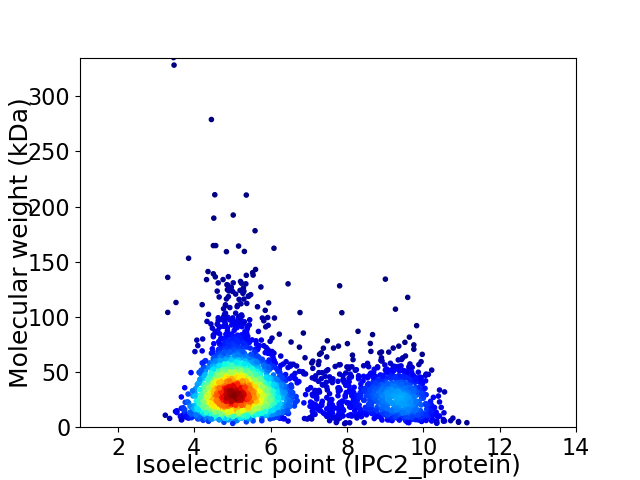
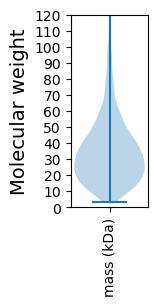
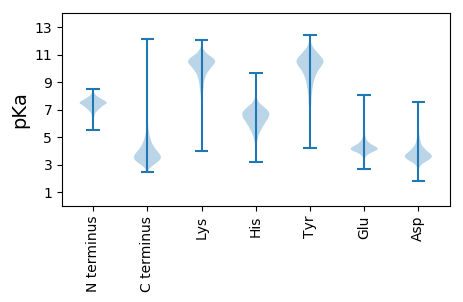
Virtual 2D-PAGE plot for 3150 proteins (isoelectric point calculated using IPC2_protein)
Get csv file with sequences according to given criteria:
* You can choose from 21 different methods for calculating isoelectric point
Summary statistics related to proteome-wise predictions


Protein with the lowest isoelectric point:
>tr|A0A2M8W727|A0A2M8W727_9MICO Putative PIG3 family NAD(P)H quinone oxidoreductase OS=Luteimicrobium subarcticum OX=620910 GN=CLV34_2658 PE=4 SV=1
MM1 pKa = 7.12LQADD5 pKa = 3.69GVMQEE10 pKa = 3.93RR11 pKa = 11.84NAVIVRR17 pKa = 11.84RR18 pKa = 11.84ALGLVAVTALVSSALVGCSRR38 pKa = 11.84GPDD41 pKa = 3.46AKK43 pKa = 10.08TLMHH47 pKa = 6.51NCVAYY52 pKa = 10.08HH53 pKa = 5.42YY54 pKa = 9.68DD55 pKa = 3.08GWGAEE60 pKa = 4.22AARR63 pKa = 11.84TVCQVEE69 pKa = 4.86FDD71 pKa = 4.14DD72 pKa = 4.18QPAYY76 pKa = 10.19SACKK80 pKa = 9.56YY81 pKa = 10.81AEE83 pKa = 4.62ADD85 pKa = 3.42PAIVDD90 pKa = 4.2RR91 pKa = 11.84EE92 pKa = 4.07AAANDD97 pKa = 4.42CDD99 pKa = 4.92AKK101 pKa = 10.74WIDD104 pKa = 4.19GGAATQGSAGGADD117 pKa = 3.66GASDD121 pKa = 4.39ADD123 pKa = 4.1DD124 pKa = 4.6DD125 pKa = 5.26ADD127 pKa = 4.18VAEE130 pKa = 5.19EE131 pKa = 4.09PQAPAPAPAASTDD144 pKa = 3.28TSADD148 pKa = 3.26AGDD151 pKa = 4.08APEE154 pKa = 5.06PPVADD159 pKa = 4.86DD160 pKa = 4.63EE161 pKa = 4.89GDD163 pKa = 3.7PMAVPAGGGVPTGVEE178 pKa = 4.14GVVQDD183 pKa = 4.87FLQATQGADD192 pKa = 2.82VDD194 pKa = 4.38LAIDD198 pKa = 3.53VLGAPGAGLSDD209 pKa = 3.24MFGTYY214 pKa = 9.91GGRR217 pKa = 11.84APYY220 pKa = 9.36TKK222 pKa = 10.49SLGCALGPDD231 pKa = 3.62GRR233 pKa = 11.84AYY235 pKa = 11.0LCDD238 pKa = 3.6VTNGTDD244 pKa = 3.47PLEE247 pKa = 3.99LVIASNADD255 pKa = 3.04HH256 pKa = 7.05AMWLLDD262 pKa = 3.56SLYY265 pKa = 11.08SADD268 pKa = 4.3PEE270 pKa = 4.22NN271 pKa = 3.64
MM1 pKa = 7.12LQADD5 pKa = 3.69GVMQEE10 pKa = 3.93RR11 pKa = 11.84NAVIVRR17 pKa = 11.84RR18 pKa = 11.84ALGLVAVTALVSSALVGCSRR38 pKa = 11.84GPDD41 pKa = 3.46AKK43 pKa = 10.08TLMHH47 pKa = 6.51NCVAYY52 pKa = 10.08HH53 pKa = 5.42YY54 pKa = 9.68DD55 pKa = 3.08GWGAEE60 pKa = 4.22AARR63 pKa = 11.84TVCQVEE69 pKa = 4.86FDD71 pKa = 4.14DD72 pKa = 4.18QPAYY76 pKa = 10.19SACKK80 pKa = 9.56YY81 pKa = 10.81AEE83 pKa = 4.62ADD85 pKa = 3.42PAIVDD90 pKa = 4.2RR91 pKa = 11.84EE92 pKa = 4.07AAANDD97 pKa = 4.42CDD99 pKa = 4.92AKK101 pKa = 10.74WIDD104 pKa = 4.19GGAATQGSAGGADD117 pKa = 3.66GASDD121 pKa = 4.39ADD123 pKa = 4.1DD124 pKa = 4.6DD125 pKa = 5.26ADD127 pKa = 4.18VAEE130 pKa = 5.19EE131 pKa = 4.09PQAPAPAPAASTDD144 pKa = 3.28TSADD148 pKa = 3.26AGDD151 pKa = 4.08APEE154 pKa = 5.06PPVADD159 pKa = 4.86DD160 pKa = 4.63EE161 pKa = 4.89GDD163 pKa = 3.7PMAVPAGGGVPTGVEE178 pKa = 4.14GVVQDD183 pKa = 4.87FLQATQGADD192 pKa = 2.82VDD194 pKa = 4.38LAIDD198 pKa = 3.53VLGAPGAGLSDD209 pKa = 3.24MFGTYY214 pKa = 9.91GGRR217 pKa = 11.84APYY220 pKa = 9.36TKK222 pKa = 10.49SLGCALGPDD231 pKa = 3.62GRR233 pKa = 11.84AYY235 pKa = 11.0LCDD238 pKa = 3.6VTNGTDD244 pKa = 3.47PLEE247 pKa = 3.99LVIASNADD255 pKa = 3.04HH256 pKa = 7.05AMWLLDD262 pKa = 3.56SLYY265 pKa = 11.08SADD268 pKa = 4.3PEE270 pKa = 4.22NN271 pKa = 3.64
Molecular weight: 27.4 kDa
Isoelectric point according different methods:
Protein with the highest isoelectric point:
>tr|A0A2M8WVZ6|A0A2M8WVZ6_9MICO Ribonuclease VapC OS=Luteimicrobium subarcticum OX=620910 GN=vapC PE=3 SV=1
MM1 pKa = 7.4GSVIKK6 pKa = 10.42KK7 pKa = 8.47RR8 pKa = 11.84RR9 pKa = 11.84KK10 pKa = 9.22RR11 pKa = 11.84MAKK14 pKa = 9.41KK15 pKa = 9.87KK16 pKa = 9.7HH17 pKa = 5.84RR18 pKa = 11.84KK19 pKa = 8.56LLRR22 pKa = 11.84KK23 pKa = 7.78TRR25 pKa = 11.84HH26 pKa = 3.65QRR28 pKa = 11.84RR29 pKa = 11.84NKK31 pKa = 9.78KK32 pKa = 9.85
MM1 pKa = 7.4GSVIKK6 pKa = 10.42KK7 pKa = 8.47RR8 pKa = 11.84RR9 pKa = 11.84KK10 pKa = 9.22RR11 pKa = 11.84MAKK14 pKa = 9.41KK15 pKa = 9.87KK16 pKa = 9.7HH17 pKa = 5.84RR18 pKa = 11.84KK19 pKa = 8.56LLRR22 pKa = 11.84KK23 pKa = 7.78TRR25 pKa = 11.84HH26 pKa = 3.65QRR28 pKa = 11.84RR29 pKa = 11.84NKK31 pKa = 9.78KK32 pKa = 9.85
Molecular weight: 4.08 kDa
Isoelectric point according different methods:
Peptides (in silico digests for buttom-up proteomics)
Below you can find in silico digests of the whole proteome with Trypsin, Chymotrypsin, Trypsin+LysC, LysN, ArgC proteases suitable for different mass spec machines.| Try ESI |
 |
|---|
| ChTry ESI |
 |
|---|
| ArgC ESI |
 |
|---|
| LysN ESI |
 |
|---|
| TryLysC ESI |
 |
|---|
| Try MALDI |
 |
|---|
| ChTry MALDI |
 |
|---|
| ArgC MALDI |
 |
|---|
| LysN MALDI |
 |
|---|
| TryLysC MALDI |
 |
|---|
| Try LTQ |
 |
|---|
| ChTry LTQ |
 |
|---|
| ArgC LTQ |
 |
|---|
| LysN LTQ |
 |
|---|
| TryLysC LTQ |
 |
|---|
| Try MSlow |
 |
|---|
| ChTry MSlow |
 |
|---|
| ArgC MSlow |
 |
|---|
| LysN MSlow |
 |
|---|
| TryLysC MSlow |
 |
|---|
| Try MShigh |
 |
|---|
| ChTry MShigh |
 |
|---|
| ArgC MShigh |
 |
|---|
| LysN MShigh |
 |
|---|
| TryLysC MShigh |
 |
|---|
General Statistics
Number of major isoforms |
Number of additional isoforms |
Number of all proteins |
Number of amino acids |
Min. Seq. Length |
Max. Seq. Length |
Avg. Seq. Length |
Avg. Mol. Weight |
|---|---|---|---|---|---|---|---|
0 |
1102968 |
30 |
3286 |
350.1 |
37.02 |
Amino acid frequency
Ala |
Cys |
Asp |
Glu |
Phe |
Gly |
His |
Ile |
Lys |
Leu |
|---|---|---|---|---|---|---|---|---|---|
14.192 ± 0.054 | 0.559 ± 0.013 |
6.878 ± 0.043 | 4.751 ± 0.049 |
2.536 ± 0.028 | 9.479 ± 0.039 |
2.104 ± 0.021 | 2.685 ± 0.037 |
1.695 ± 0.032 | 9.892 ± 0.054 |
Met |
Asn |
Gln |
Pro |
Arg |
Ser |
Thr |
Val |
Trp |
Tyr |
|---|---|---|---|---|---|---|---|---|---|
1.421 ± 0.017 | 1.532 ± 0.023 |
5.901 ± 0.036 | 2.587 ± 0.02 |
7.616 ± 0.066 | 5.353 ± 0.041 |
6.889 ± 0.072 | 10.498 ± 0.054 |
1.549 ± 0.018 | 1.883 ± 0.023 |
Most of the basic statistics you can see at this page can be downloaded from this CSV file
Proteome-pI is available under Creative Commons Attribution-NoDerivs license, for more details see here
| Reference: Kozlowski LP. Proteome-pI 2.0: Proteome Isoelectric Point Database Update. Nucleic Acids Res. 2021, doi: 10.1093/nar/gkab944 | Contact: Lukasz P. Kozlowski |
