Lachnospiraceae bacterium KHCPX20
Taxonomy: cellular organisms; Bacteria; Terrabacteria group; Firmicutes; Clostridia; Eubacteriales; Lachnospiraceae; unclassified Lachnospiraceae
Average proteome isoelectric point is 6.15
Get precalculated fractions of proteins

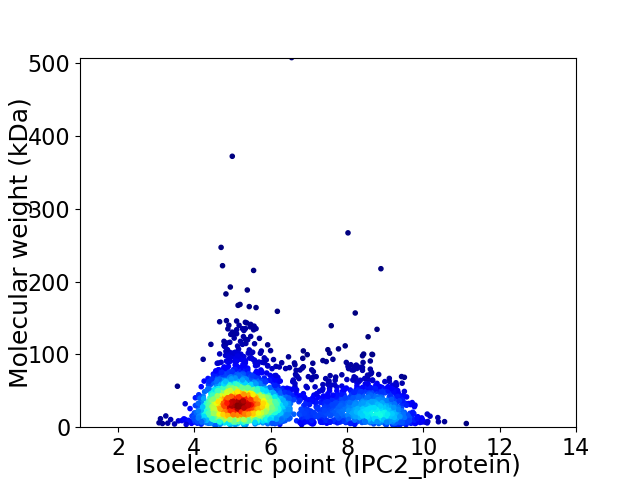
Virtual 2D-PAGE plot for 2926 proteins (isoelectric point calculated using IPC2_protein)
Get csv file with sequences according to given criteria:
* You can choose from 21 different methods for calculating isoelectric point
Summary statistics related to proteome-wise predictions


Protein with the lowest isoelectric point:
>tr|A0A1H2W9K9|A0A1H2W9K9_9FIRM Putative hydrolase of the HAD superfamily OS=Lachnospiraceae bacterium KHCPX20 OX=1855375 GN=SAMN05216391_1171 PE=4 SV=1
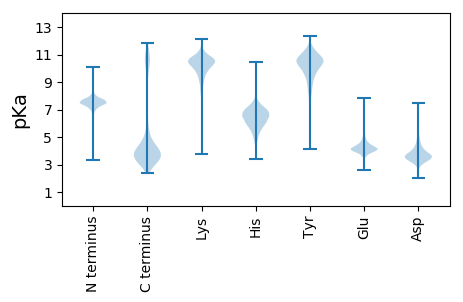
MM1 pKa = 7.54TDD3 pKa = 3.08ADD5 pKa = 3.98RR6 pKa = 11.84AEE8 pKa = 4.0AFINGWYY15 pKa = 10.22VKK17 pKa = 10.3GSTGSSSGGMEE28 pKa = 4.69GGPGGNGGPGGNDD41 pKa = 3.28GPGGDD46 pKa = 4.01NAGGPPSGEE55 pKa = 4.28KK56 pKa = 10.4PNGAGPGGDD65 pKa = 3.34NAGGPHH71 pKa = 6.51AMNGGSSDD79 pKa = 3.76EE80 pKa = 4.34VGTPDD85 pKa = 4.72SGTTQSASSKK95 pKa = 9.15TDD97 pKa = 3.05SANYY101 pKa = 10.26SSFAEE106 pKa = 4.05MLAAYY111 pKa = 9.5QADD114 pKa = 3.37IAEE117 pKa = 4.26IQAGDD122 pKa = 3.51EE123 pKa = 4.15YY124 pKa = 11.33GNNIVDD130 pKa = 5.12LYY132 pKa = 11.59NPLNYY137 pKa = 9.56IGADD141 pKa = 3.6GTDD144 pKa = 3.29GPTWARR150 pKa = 11.84ILMGASEE157 pKa = 4.8GDD159 pKa = 3.02ISMMNSLNLQVAWLNSGTDD178 pKa = 5.57AEE180 pKa = 6.16IEE182 pKa = 4.18WQWNGGHH189 pKa = 5.84VPSEE193 pKa = 3.92IFGDD197 pKa = 4.07SLALYY202 pKa = 9.53VDD204 pKa = 3.96TMYY207 pKa = 11.43GEE209 pKa = 4.5YY210 pKa = 10.56VDD212 pKa = 4.39GAVKK216 pKa = 8.83ITKK219 pKa = 9.68AAASGQTTNGDD230 pKa = 3.29GTEE233 pKa = 4.09PSGTDD238 pKa = 3.04LSAWVSYY245 pKa = 11.07DD246 pKa = 3.18STSGVGMTLAGAAAYY261 pKa = 7.55RR262 pKa = 11.84TSGASKK268 pKa = 10.59AMPGFDD274 pKa = 3.49VMDD277 pKa = 4.28YY278 pKa = 10.69GQEE281 pKa = 3.98DD282 pKa = 5.17YY283 pKa = 11.81VFGSSTADD291 pKa = 2.98ARR293 pKa = 11.84HH294 pKa = 6.2WDD296 pKa = 3.75TYY298 pKa = 7.54VLKK301 pKa = 10.9VFEE304 pKa = 4.28EE305 pKa = 4.45HH306 pKa = 7.48ADD308 pKa = 3.62TLAEE312 pKa = 4.11LFNN315 pKa = 4.61
MM1 pKa = 7.54TDD3 pKa = 3.08ADD5 pKa = 3.98RR6 pKa = 11.84AEE8 pKa = 4.0AFINGWYY15 pKa = 10.22VKK17 pKa = 10.3GSTGSSSGGMEE28 pKa = 4.69GGPGGNGGPGGNDD41 pKa = 3.28GPGGDD46 pKa = 4.01NAGGPPSGEE55 pKa = 4.28KK56 pKa = 10.4PNGAGPGGDD65 pKa = 3.34NAGGPHH71 pKa = 6.51AMNGGSSDD79 pKa = 3.76EE80 pKa = 4.34VGTPDD85 pKa = 4.72SGTTQSASSKK95 pKa = 9.15TDD97 pKa = 3.05SANYY101 pKa = 10.26SSFAEE106 pKa = 4.05MLAAYY111 pKa = 9.5QADD114 pKa = 3.37IAEE117 pKa = 4.26IQAGDD122 pKa = 3.51EE123 pKa = 4.15YY124 pKa = 11.33GNNIVDD130 pKa = 5.12LYY132 pKa = 11.59NPLNYY137 pKa = 9.56IGADD141 pKa = 3.6GTDD144 pKa = 3.29GPTWARR150 pKa = 11.84ILMGASEE157 pKa = 4.8GDD159 pKa = 3.02ISMMNSLNLQVAWLNSGTDD178 pKa = 5.57AEE180 pKa = 6.16IEE182 pKa = 4.18WQWNGGHH189 pKa = 5.84VPSEE193 pKa = 3.92IFGDD197 pKa = 4.07SLALYY202 pKa = 9.53VDD204 pKa = 3.96TMYY207 pKa = 11.43GEE209 pKa = 4.5YY210 pKa = 10.56VDD212 pKa = 4.39GAVKK216 pKa = 8.83ITKK219 pKa = 9.68AAASGQTTNGDD230 pKa = 3.29GTEE233 pKa = 4.09PSGTDD238 pKa = 3.04LSAWVSYY245 pKa = 11.07DD246 pKa = 3.18STSGVGMTLAGAAAYY261 pKa = 7.55RR262 pKa = 11.84TSGASKK268 pKa = 10.59AMPGFDD274 pKa = 3.49VMDD277 pKa = 4.28YY278 pKa = 10.69GQEE281 pKa = 3.98DD282 pKa = 5.17YY283 pKa = 11.81VFGSSTADD291 pKa = 2.98ARR293 pKa = 11.84HH294 pKa = 6.2WDD296 pKa = 3.75TYY298 pKa = 7.54VLKK301 pKa = 10.9VFEE304 pKa = 4.28EE305 pKa = 4.45HH306 pKa = 7.48ADD308 pKa = 3.62TLAEE312 pKa = 4.11LFNN315 pKa = 4.61
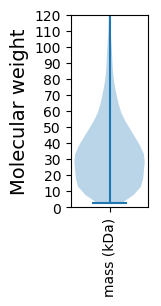
Molecular weight: 32.18 kDa
Isoelectric point according different methods:
Protein with the highest isoelectric point:
>tr|A0A1H2UP34|A0A1H2UP34_9FIRM Transcriptional regulator LacI family OS=Lachnospiraceae bacterium KHCPX20 OX=1855375 GN=SAMN05216391_11161 PE=4 SV=1
MM1 pKa = 7.67KK2 pKa = 8.72MTFQPKK8 pKa = 8.79KK9 pKa = 7.6RR10 pKa = 11.84QRR12 pKa = 11.84AKK14 pKa = 9.2VHH16 pKa = 5.65GFRR19 pKa = 11.84SRR21 pKa = 11.84MSTKK25 pKa = 10.28GGRR28 pKa = 11.84KK29 pKa = 9.04VIAARR34 pKa = 11.84RR35 pKa = 11.84AKK37 pKa = 10.06GRR39 pKa = 11.84KK40 pKa = 8.83KK41 pKa = 10.63LSAA44 pKa = 3.95
MM1 pKa = 7.67KK2 pKa = 8.72MTFQPKK8 pKa = 8.79KK9 pKa = 7.6RR10 pKa = 11.84QRR12 pKa = 11.84AKK14 pKa = 9.2VHH16 pKa = 5.65GFRR19 pKa = 11.84SRR21 pKa = 11.84MSTKK25 pKa = 10.28GGRR28 pKa = 11.84KK29 pKa = 9.04VIAARR34 pKa = 11.84RR35 pKa = 11.84AKK37 pKa = 10.06GRR39 pKa = 11.84KK40 pKa = 8.83KK41 pKa = 10.63LSAA44 pKa = 3.95
Molecular weight: 5.07 kDa
Isoelectric point according different methods:
Peptides (in silico digests for buttom-up proteomics)
Below you can find in silico digests of the whole proteome with Trypsin, Chymotrypsin, Trypsin+LysC, LysN, ArgC proteases suitable for different mass spec machines.| Try ESI |
 |
|---|
| ChTry ESI |
 |
|---|
| ArgC ESI |
 |
|---|
| LysN ESI |
 |
|---|
| TryLysC ESI |
 |
|---|
| Try MALDI |
 |
|---|
| ChTry MALDI |
 |
|---|
| ArgC MALDI |
 |
|---|
| LysN MALDI |
 |
|---|
| TryLysC MALDI |
 |
|---|
| Try LTQ |
 |
|---|
| ChTry LTQ |
 |
|---|
| ArgC LTQ |
 |
|---|
| LysN LTQ |
 |
|---|
| TryLysC LTQ |
 |
|---|
| Try MSlow |
 |
|---|
| ChTry MSlow |
 |
|---|
| ArgC MSlow |
 |
|---|
| LysN MSlow |
 |
|---|
| TryLysC MSlow |
 |
|---|
| Try MShigh |
 |
|---|
| ChTry MShigh |
 |
|---|
| ArgC MShigh |
 |
|---|
| LysN MShigh |
 |
|---|
| TryLysC MShigh |
 |
|---|
General Statistics
Number of major isoforms |
Number of additional isoforms |
Number of all proteins |
Number of amino acids |
Min. Seq. Length |
Max. Seq. Length |
Avg. Seq. Length |
Avg. Mol. Weight |
|---|---|---|---|---|---|---|---|
0 |
953569 |
25 |
4544 |
325.9 |
36.6 |
Amino acid frequency
Ala |
Cys |
Asp |
Glu |
Phe |
Gly |
His |
Ile |
Lys |
Leu |
|---|---|---|---|---|---|---|---|---|---|
7.443 ± 0.051 | 1.317 ± 0.019 |
6.185 ± 0.04 | 7.417 ± 0.056 |
3.94 ± 0.03 | 6.853 ± 0.04 |
1.873 ± 0.021 | 6.981 ± 0.044 |
7.302 ± 0.051 | 8.767 ± 0.054 |
Met |
Asn |
Gln |
Pro |
Arg |
Ser |
Thr |
Val |
Trp |
Tyr |
|---|---|---|---|---|---|---|---|---|---|
3.066 ± 0.032 | 4.364 ± 0.037 |
3.19 ± 0.025 | 3.27 ± 0.025 |
4.535 ± 0.036 | 6.081 ± 0.036 |
5.555 ± 0.044 | 6.826 ± 0.048 |
0.843 ± 0.016 | 4.192 ± 0.034 |
Most of the basic statistics you can see at this page can be downloaded from this CSV file
Proteome-pI is available under Creative Commons Attribution-NoDerivs license, for more details see here
| Reference: Kozlowski LP. Proteome-pI 2.0: Proteome Isoelectric Point Database Update. Nucleic Acids Res. 2021, doi: 10.1093/nar/gkab944 | Contact: Lukasz P. Kozlowski |
