SAR202 cluster bacterium AC-647-P02_OGT_505m
Taxonomy: cellular organisms; Bacteria; Terrabacteria group; Chloroflexi; Chloroflexi incertae sedis; SAR202 cluster
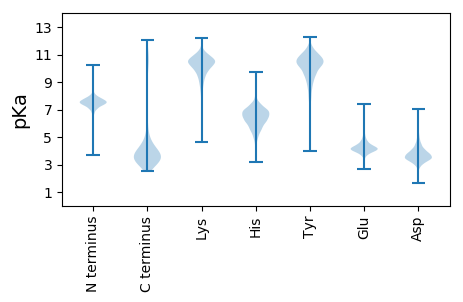
Average proteome isoelectric point is 5.64
Get precalculated fractions of proteins

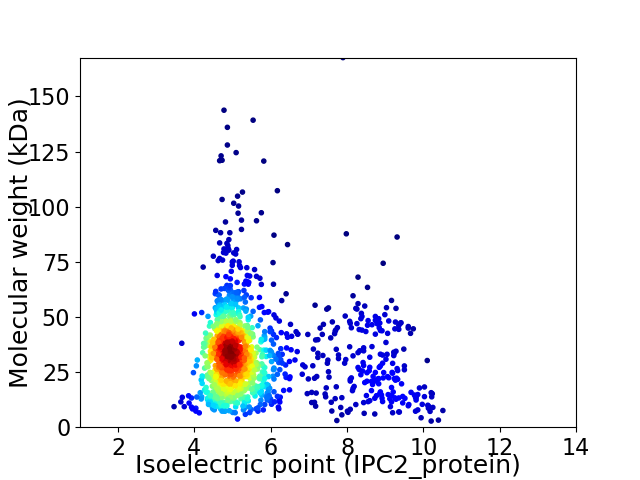
Virtual 2D-PAGE plot for 1332 proteins (isoelectric point calculated using IPC2_protein)
Get csv file with sequences according to given criteria:
* You can choose from 21 different methods for calculating isoelectric point
Summary statistics related to proteome-wise predictions


Protein with the lowest isoelectric point:
>tr|A0A5N8YM26|A0A5N8YM26_9CHLR Uncharacterized protein OS=SAR202 cluster bacterium AC-647-P02_OGT_505m OX=2587832 GN=FIM09_06470 PE=3 SV=1
MM1 pKa = 6.88AQYY4 pKa = 10.01MVVHH8 pKa = 6.28SLKK11 pKa = 10.7VPADD15 pKa = 3.53QFSQAMEE22 pKa = 4.93DD23 pKa = 3.65DD24 pKa = 4.82SITEE28 pKa = 3.89FAKK31 pKa = 10.71AMQAGEE37 pKa = 4.37TPAKK41 pKa = 9.99CVKK44 pKa = 9.59SWNPLPYY51 pKa = 10.73GNTDD55 pKa = 3.15TFICLWEE62 pKa = 4.53ANNEE66 pKa = 3.83EE67 pKa = 5.21DD68 pKa = 4.48IVATLGEE75 pKa = 4.8MIEE78 pKa = 4.66MITCEE83 pKa = 3.96PMEE86 pKa = 4.26VDD88 pKa = 4.23EE89 pKa = 5.74IDD91 pKa = 3.23WAQIAASS98 pKa = 3.64
MM1 pKa = 6.88AQYY4 pKa = 10.01MVVHH8 pKa = 6.28SLKK11 pKa = 10.7VPADD15 pKa = 3.53QFSQAMEE22 pKa = 4.93DD23 pKa = 3.65DD24 pKa = 4.82SITEE28 pKa = 3.89FAKK31 pKa = 10.71AMQAGEE37 pKa = 4.37TPAKK41 pKa = 9.99CVKK44 pKa = 9.59SWNPLPYY51 pKa = 10.73GNTDD55 pKa = 3.15TFICLWEE62 pKa = 4.53ANNEE66 pKa = 3.83EE67 pKa = 5.21DD68 pKa = 4.48IVATLGEE75 pKa = 4.8MIEE78 pKa = 4.66MITCEE83 pKa = 3.96PMEE86 pKa = 4.26VDD88 pKa = 4.23EE89 pKa = 5.74IDD91 pKa = 3.23WAQIAASS98 pKa = 3.64
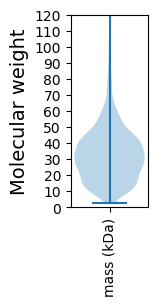
Molecular weight: 10.94 kDa
Isoelectric point according different methods:
Protein with the highest isoelectric point:
>tr|A0A5N8YKK7|A0A5N8YKK7_9CHLR Mandelate racemase OS=SAR202 cluster bacterium AC-647-P02_OGT_505m OX=2587832 GN=FIM09_02990 PE=4 SV=1
MM1 pKa = 7.54KK2 pKa = 10.18ISSPVLKK9 pKa = 10.78LRR11 pKa = 11.84DD12 pKa = 3.77FRR14 pKa = 11.84MLIAATFFEE23 pKa = 4.65SFMRR27 pKa = 11.84GEE29 pKa = 4.13NVVLGWVVLEE39 pKa = 4.29MTDD42 pKa = 3.41SPFMVGLTMGIRR54 pKa = 11.84AAPGFFLGITAGTISDD70 pKa = 3.71LVDD73 pKa = 2.87RR74 pKa = 11.84RR75 pKa = 11.84KK76 pKa = 10.34FMRR79 pKa = 11.84LLMALAALVALTMGLLLASGNVEE102 pKa = 4.1LWHH105 pKa = 6.68LLAIPVFSGTIHH117 pKa = 6.36MMFNTAKK124 pKa = 10.16QSFVFDD130 pKa = 3.46LVGRR134 pKa = 11.84EE135 pKa = 3.73NGLNGMSYY143 pKa = 10.73LGLSMRR149 pKa = 11.84GGGMLGALGVGFALARR165 pKa = 11.84WGAGAGYY172 pKa = 9.42FVVAVACCISVGFIGFIRR190 pKa = 11.84SRR192 pKa = 11.84GKK194 pKa = 9.87SAPSRR199 pKa = 11.84KK200 pKa = 9.93GNILTGFSEE209 pKa = 5.49FWRR212 pKa = 11.84EE213 pKa = 3.45MRR215 pKa = 11.84QNRR218 pKa = 11.84TIAGLVLIVMLVEE231 pKa = 4.71FFGFTPNNALMPSIARR247 pKa = 11.84DD248 pKa = 3.4VWGLGPQGLGILNAFSSGGGMLAIAVISLVGHH280 pKa = 6.64IRR282 pKa = 11.84YY283 pKa = 9.3QGLAFIVVLHH293 pKa = 6.23LFGGALLLLGFAPSVYY309 pKa = 9.86VAVIAIVILSGTMALSDD326 pKa = 4.64LFSQTLLQRR335 pKa = 11.84LVPNDD340 pKa = 3.1LRR342 pKa = 11.84GRR344 pKa = 11.84IMGAWTTAVGTSPVGNLEE362 pKa = 3.72IGALASFMGVTVALAFHH379 pKa = 6.72GGGLVLLAVITLLAFKK395 pKa = 10.27RR396 pKa = 11.84LRR398 pKa = 11.84SII400 pKa = 4.24
MM1 pKa = 7.54KK2 pKa = 10.18ISSPVLKK9 pKa = 10.78LRR11 pKa = 11.84DD12 pKa = 3.77FRR14 pKa = 11.84MLIAATFFEE23 pKa = 4.65SFMRR27 pKa = 11.84GEE29 pKa = 4.13NVVLGWVVLEE39 pKa = 4.29MTDD42 pKa = 3.41SPFMVGLTMGIRR54 pKa = 11.84AAPGFFLGITAGTISDD70 pKa = 3.71LVDD73 pKa = 2.87RR74 pKa = 11.84RR75 pKa = 11.84KK76 pKa = 10.34FMRR79 pKa = 11.84LLMALAALVALTMGLLLASGNVEE102 pKa = 4.1LWHH105 pKa = 6.68LLAIPVFSGTIHH117 pKa = 6.36MMFNTAKK124 pKa = 10.16QSFVFDD130 pKa = 3.46LVGRR134 pKa = 11.84EE135 pKa = 3.73NGLNGMSYY143 pKa = 10.73LGLSMRR149 pKa = 11.84GGGMLGALGVGFALARR165 pKa = 11.84WGAGAGYY172 pKa = 9.42FVVAVACCISVGFIGFIRR190 pKa = 11.84SRR192 pKa = 11.84GKK194 pKa = 9.87SAPSRR199 pKa = 11.84KK200 pKa = 9.93GNILTGFSEE209 pKa = 5.49FWRR212 pKa = 11.84EE213 pKa = 3.45MRR215 pKa = 11.84QNRR218 pKa = 11.84TIAGLVLIVMLVEE231 pKa = 4.71FFGFTPNNALMPSIARR247 pKa = 11.84DD248 pKa = 3.4VWGLGPQGLGILNAFSSGGGMLAIAVISLVGHH280 pKa = 6.64IRR282 pKa = 11.84YY283 pKa = 9.3QGLAFIVVLHH293 pKa = 6.23LFGGALLLLGFAPSVYY309 pKa = 9.86VAVIAIVILSGTMALSDD326 pKa = 4.64LFSQTLLQRR335 pKa = 11.84LVPNDD340 pKa = 3.1LRR342 pKa = 11.84GRR344 pKa = 11.84IMGAWTTAVGTSPVGNLEE362 pKa = 3.72IGALASFMGVTVALAFHH379 pKa = 6.72GGGLVLLAVITLLAFKK395 pKa = 10.27RR396 pKa = 11.84LRR398 pKa = 11.84SII400 pKa = 4.24
Molecular weight: 42.56 kDa
Isoelectric point according different methods:
Peptides (in silico digests for buttom-up proteomics)
Below you can find in silico digests of the whole proteome with Trypsin, Chymotrypsin, Trypsin+LysC, LysN, ArgC proteases suitable for different mass spec machines.| Try ESI |
 |
|---|
| ChTry ESI |
 |
|---|
| ArgC ESI |
 |
|---|
| LysN ESI |
 |
|---|
| TryLysC ESI |
 |
|---|
| Try MALDI |
 |
|---|
| ChTry MALDI |
 |
|---|
| ArgC MALDI |
 |
|---|
| LysN MALDI |
 |
|---|
| TryLysC MALDI |
 |
|---|
| Try LTQ |
 |
|---|
| ChTry LTQ |
 |
|---|
| ArgC LTQ |
 |
|---|
| LysN LTQ |
 |
|---|
| TryLysC LTQ |
 |
|---|
| Try MSlow |
 |
|---|
| ChTry MSlow |
 |
|---|
| ArgC MSlow |
 |
|---|
| LysN MSlow |
 |
|---|
| TryLysC MSlow |
 |
|---|
| Try MShigh |
 |
|---|
| ChTry MShigh |
 |
|---|
| ArgC MShigh |
 |
|---|
| LysN MShigh |
 |
|---|
| TryLysC MShigh |
 |
|---|
General Statistics
Number of major isoforms |
Number of additional isoforms |
Number of all proteins |
Number of amino acids |
Min. Seq. Length |
Max. Seq. Length |
Avg. Seq. Length |
Avg. Mol. Weight |
|---|---|---|---|---|---|---|---|
0 |
411302 |
27 |
1494 |
308.8 |
33.97 |
Amino acid frequency
Ala |
Cys |
Asp |
Glu |
Phe |
Gly |
His |
Ile |
Lys |
Leu |
|---|---|---|---|---|---|---|---|---|---|
7.59 ± 0.059 | 0.908 ± 0.02 |
5.902 ± 0.059 | 6.599 ± 0.064 |
4.001 ± 0.051 | 8.436 ± 0.049 |
2.022 ± 0.03 | 7.232 ± 0.058 |
4.327 ± 0.047 | 9.113 ± 0.078 |
Met |
Asn |
Gln |
Pro |
Arg |
Ser |
Thr |
Val |
Trp |
Tyr |
|---|---|---|---|---|---|---|---|---|---|
2.758 ± 0.026 | 3.979 ± 0.035 |
4.58 ± 0.04 | 2.921 ± 0.03 |
5.046 ± 0.047 | 7.547 ± 0.058 |
5.452 ± 0.037 | 7.401 ± 0.051 |
1.334 ± 0.029 | 2.852 ± 0.028 |
Most of the basic statistics you can see at this page can be downloaded from this CSV file
Proteome-pI is available under Creative Commons Attribution-NoDerivs license, for more details see here
| Reference: Kozlowski LP. Proteome-pI 2.0: Proteome Isoelectric Point Database Update. Nucleic Acids Res. 2021, doi: 10.1093/nar/gkab944 | Contact: Lukasz P. Kozlowski |
