Olavius sp. associated proteobacterium Delta 1
Taxonomy: cellular organisms; Bacteria; Proteobacteria; delta/epsilon subdivisions; Deltaproteobacteria; unclassified Deltaproteobacteria
Average proteome isoelectric point is 6.91
Get precalculated fractions of proteins

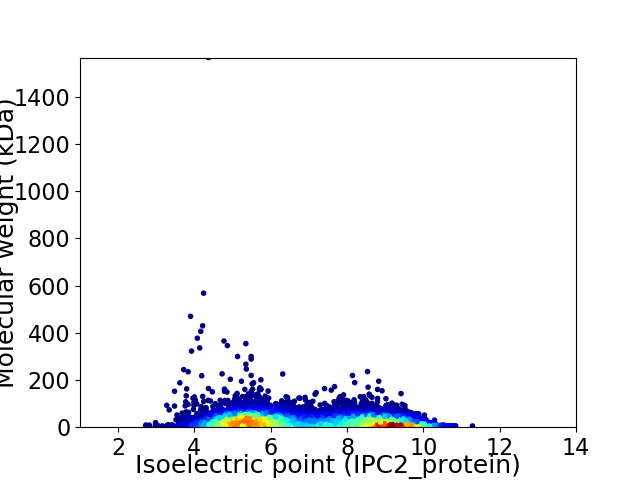
Virtual 2D-PAGE plot for 10776 proteins (isoelectric point calculated using IPC2_protein)
Get csv file with sequences according to given criteria:
* You can choose from 21 different methods for calculating isoelectric point
Summary statistics related to proteome-wise predictions


Protein with the lowest isoelectric point:
>tr|A0A6J4XFR5|A0A6J4XFR5_9DELT Glycine betaine ABC transport system glycine betaine-binding protein OpuAC OS=Olavius sp. associated proteobacterium Delta 1 OX=698986 GN=D1BOALGB6SA_8809 PE=4 SV=1
YYY2 pKa = 9.75YYY4 pKa = 10.64FDDD7 pKa = 5.8DD8 pKa = 4.68GDDD11 pKa = 3.64LYYY14 pKa = 10.96RR15 pKa = 11.84EEE17 pKa = 4.13PDDD20 pKa = 4.17DD21 pKa = 5.34RR22 pKa = 11.84MQWKKK27 pKa = 8.86QWAGYYY33 pKa = 8.28QLYYY37 pKa = 10.01YY38 pKa = 10.96DD39 pKa = 4.04AVDDD43 pKa = 3.78YY44 pKa = 9.95EE45 pKa = 4.16WPNQVVNDDD54 pKa = 3.97ALTLDDD60 pKa = 4.29ADDD63 pKa = 4.73DDD65 pKa = 4.55PRR67 pKa = 11.84SHHH70 pKa = 7.21MDDD73 pKa = 3.76ATTFDDD79 pKa = 5.08NATYYY84 pKa = 9.85HH85 pKa = 5.8FTSDDD90 pKa = 2.84GAIIVDDD97 pKa = 3.95DD98 pKa = 3.95DDD100 pKa = 4.57EEE102 pKa = 4.42SKKK105 pKa = 9.97PTGVGEEE112 pKa = 4.11TLLSTGFEEE121 pKa = 4.21EE122 pKa = 6.72SPAWQAHHH130 pKa = 4.57DDD132 pKa = 3.99NGAPDDD138 pKa = 3.27TRR140 pKa = 11.84ATDDD144 pKa = 3.6DDD146 pKa = 4.5HH147 pKa = 6.39GSWSAKKK154 pKa = 9.54DDD156 pKa = 3.41TNQGNLTSDDD166 pKa = 3.4LDDD169 pKa = 3.73GDDD172 pKa = 4.16VAANGDDD179 pKa = 4.29ITVDDD184 pKa = 3.7WFRR187 pKa = 11.84KKK189 pKa = 10.01DD190 pKa = 4.87DD191 pKa = 3.78EEE193 pKa = 5.96DD194 pKa = 3.9DD195 pKa = 4.01EE196 pKa = 5.58ILYYY200 pKa = 10.53YY201 pKa = 10.46YY202 pKa = 10.82DD203 pKa = 3.55ANYYY207 pKa = 10.12DD208 pKa = 4.76IMDDD212 pKa = 5.0EEE214 pKa = 5.55DD215 pKa = 5.03YYY217 pKa = 9.72DDD219 pKa = 3.28RR220 pKa = 11.84DDD222 pKa = 3.73DD223 pKa = 3.29WIHHH227 pKa = 4.64YY228 pKa = 10.13EEE230 pKa = 5.11ITDDD234 pKa = 3.7DD235 pKa = 3.73YYY237 pKa = 10.02TSNFRR242 pKa = 11.84IRR244 pKa = 11.84FYYY247 pKa = 11.1HH248 pKa = 6.47KK249 pKa = 9.73TSTRR253 pKa = 11.84EEE255 pKa = 4.01VWIDDD260 pKa = 3.31DD261 pKa = 4.79EEE263 pKa = 4.16TKKK266 pKa = 10.81GGGTGGWEEE275 pKa = 3.94EE276 pKa = 4.24TGSDDD281 pKa = 3.09AYYY284 pKa = 10.76GDDD287 pKa = 4.07YY288 pKa = 9.58WTGADDD294 pKa = 3.47DDD296 pKa = 4.56YY297 pKa = 10.16ATWTPDDD304 pKa = 2.9PEEE307 pKa = 5.3DD308 pKa = 3.7EE309 pKa = 5.33DD310 pKa = 4.51DDD312 pKa = 4.18YY313 pKa = 11.37DD314 pKa = 5.2YYY316 pKa = 11.56RR317 pKa = 11.84WHHH320 pKa = 5.52
YYY2 pKa = 9.75YYY4 pKa = 10.64FDDD7 pKa = 5.8DD8 pKa = 4.68GDDD11 pKa = 3.64LYYY14 pKa = 10.96RR15 pKa = 11.84EEE17 pKa = 4.13PDDD20 pKa = 4.17DD21 pKa = 5.34RR22 pKa = 11.84MQWKKK27 pKa = 8.86QWAGYYY33 pKa = 8.28QLYYY37 pKa = 10.01YY38 pKa = 10.96DD39 pKa = 4.04AVDDD43 pKa = 3.78YY44 pKa = 9.95EE45 pKa = 4.16WPNQVVNDDD54 pKa = 3.97ALTLDDD60 pKa = 4.29ADDD63 pKa = 4.73DDD65 pKa = 4.55PRR67 pKa = 11.84SHHH70 pKa = 7.21MDDD73 pKa = 3.76ATTFDDD79 pKa = 5.08NATYYY84 pKa = 9.85HH85 pKa = 5.8FTSDDD90 pKa = 2.84GAIIVDDD97 pKa = 3.95DD98 pKa = 3.95DDD100 pKa = 4.57EEE102 pKa = 4.42SKKK105 pKa = 9.97PTGVGEEE112 pKa = 4.11TLLSTGFEEE121 pKa = 4.21EE122 pKa = 6.72SPAWQAHHH130 pKa = 4.57DDD132 pKa = 3.99NGAPDDD138 pKa = 3.27TRR140 pKa = 11.84ATDDD144 pKa = 3.6DDD146 pKa = 4.5HH147 pKa = 6.39GSWSAKKK154 pKa = 9.54DDD156 pKa = 3.41TNQGNLTSDDD166 pKa = 3.4LDDD169 pKa = 3.73GDDD172 pKa = 4.16VAANGDDD179 pKa = 4.29ITVDDD184 pKa = 3.7WFRR187 pKa = 11.84KKK189 pKa = 10.01DD190 pKa = 4.87DD191 pKa = 3.78EEE193 pKa = 5.96DD194 pKa = 3.9DD195 pKa = 4.01EE196 pKa = 5.58ILYYY200 pKa = 10.53YY201 pKa = 10.46YY202 pKa = 10.82DD203 pKa = 3.55ANYYY207 pKa = 10.12DD208 pKa = 4.76IMDDD212 pKa = 5.0EEE214 pKa = 5.55DD215 pKa = 5.03YYY217 pKa = 9.72DDD219 pKa = 3.28RR220 pKa = 11.84DDD222 pKa = 3.73DD223 pKa = 3.29WIHHH227 pKa = 4.64YY228 pKa = 10.13EEE230 pKa = 5.11ITDDD234 pKa = 3.7DD235 pKa = 3.73YYY237 pKa = 10.02TSNFRR242 pKa = 11.84IRR244 pKa = 11.84FYYY247 pKa = 11.1HH248 pKa = 6.47KK249 pKa = 9.73TSTRR253 pKa = 11.84EEE255 pKa = 4.01VWIDDD260 pKa = 3.31DD261 pKa = 4.79EEE263 pKa = 4.16TKKK266 pKa = 10.81GGGTGGWEEE275 pKa = 3.94EE276 pKa = 4.24TGSDDD281 pKa = 3.09AYYY284 pKa = 10.76GDDD287 pKa = 4.07YY288 pKa = 9.58WTGADDD294 pKa = 3.47DDD296 pKa = 4.56YY297 pKa = 10.16ATWTPDDD304 pKa = 2.9PEEE307 pKa = 5.3DD308 pKa = 3.7EE309 pKa = 5.33DD310 pKa = 4.51DDD312 pKa = 4.18YY313 pKa = 11.37DD314 pKa = 5.2YYY316 pKa = 11.56RR317 pKa = 11.84WHHH320 pKa = 5.52
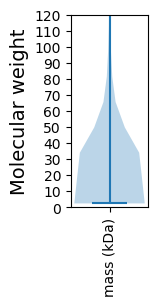
Molecular weight: 36.53 kDa
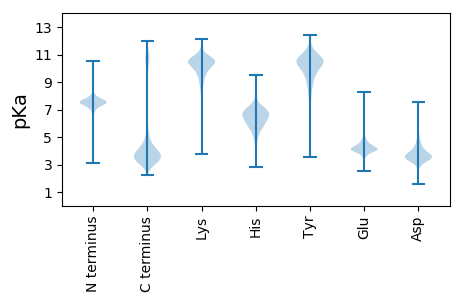
Isoelectric point according different methods:
Protein with the highest isoelectric point:
>tr|A0A6J4XFE4|A0A6J4XFE4_9DELT Uncharacterized protein OS=Olavius sp. associated proteobacterium Delta 1 OX=698986 GN=D1BOALGB6SA_7237 PE=4 SV=1
MM1 pKa = 7.45KK2 pKa = 9.56RR3 pKa = 11.84TFQPSRR9 pKa = 11.84IKK11 pKa = 10.45RR12 pKa = 11.84ARR14 pKa = 11.84NHH16 pKa = 6.07GFLKK20 pKa = 10.62RR21 pKa = 11.84MSTKK25 pKa = 9.49QGRR28 pKa = 11.84RR29 pKa = 11.84IINRR33 pKa = 11.84RR34 pKa = 11.84RR35 pKa = 11.84AKK37 pKa = 10.3GRR39 pKa = 11.84ARR41 pKa = 11.84LAGG44 pKa = 3.63
MM1 pKa = 7.45KK2 pKa = 9.56RR3 pKa = 11.84TFQPSRR9 pKa = 11.84IKK11 pKa = 10.45RR12 pKa = 11.84ARR14 pKa = 11.84NHH16 pKa = 6.07GFLKK20 pKa = 10.62RR21 pKa = 11.84MSTKK25 pKa = 9.49QGRR28 pKa = 11.84RR29 pKa = 11.84IINRR33 pKa = 11.84RR34 pKa = 11.84RR35 pKa = 11.84AKK37 pKa = 10.3GRR39 pKa = 11.84ARR41 pKa = 11.84LAGG44 pKa = 3.63
Molecular weight: 5.26 kDa
Isoelectric point according different methods:
Peptides (in silico digests for buttom-up proteomics)
Below you can find in silico digests of the whole proteome with Trypsin, Chymotrypsin, Trypsin+LysC, LysN, ArgC proteases suitable for different mass spec machines.| Try ESI |
 |
|---|
| ChTry ESI |
 |
|---|
| ArgC ESI |
 |
|---|
| LysN ESI |
 |
|---|
| TryLysC ESI |
 |
|---|
| Try MALDI |
 |
|---|
| ChTry MALDI |
 |
|---|
| ArgC MALDI |
 |
|---|
| LysN MALDI |
 |
|---|
| TryLysC MALDI |
 |
|---|
| Try LTQ |
 |
|---|
| ChTry LTQ |
 |
|---|
| ArgC LTQ |
 |
|---|
| LysN LTQ |
 |
|---|
| TryLysC LTQ |
 |
|---|
| Try MSlow |
 |
|---|
| ChTry MSlow |
 |
|---|
| ArgC MSlow |
 |
|---|
| LysN MSlow |
 |
|---|
| TryLysC MSlow |
 |
|---|
| Try MShigh |
 |
|---|
| ChTry MShigh |
 |
|---|
| ArgC MShigh |
 |
|---|
| LysN MShigh |
 |
|---|
| TryLysC MShigh |
 |
|---|
General Statistics
Number of major isoforms |
Number of additional isoforms |
Number of all proteins |
Number of amino acids |
Min. Seq. Length |
Max. Seq. Length |
Avg. Seq. Length |
Avg. Mol. Weight |
|---|---|---|---|---|---|---|---|
0 |
2777551 |
20 |
14640 |
257.8 |
28.76 |
Amino acid frequency
Ala |
Cys |
Asp |
Glu |
Phe |
Gly |
His |
Ile |
Lys |
Leu |
|---|---|---|---|---|---|---|---|---|---|
8.26 ± 0.027 | 1.225 ± 0.014 |
5.568 ± 0.027 | 5.994 ± 0.025 |
4.477 ± 0.017 | 7.339 ± 0.027 |
2.05 ± 0.012 | 7.291 ± 0.028 |
5.832 ± 0.036 | 9.874 ± 0.031 |
Met |
Asn |
Gln |
Pro |
Arg |
Ser |
Thr |
Val |
Trp |
Tyr |
|---|---|---|---|---|---|---|---|---|---|
2.623 ± 0.016 | 3.969 ± 0.018 |
4.39 ± 0.016 | 3.626 ± 0.014 |
5.391 ± 0.022 | 5.953 ± 0.019 |
5.035 ± 0.022 | 6.64 ± 0.023 |
1.23 ± 0.01 | 3.235 ± 0.018 |
Most of the basic statistics you can see at this page can be downloaded from this CSV file
Proteome-pI is available under Creative Commons Attribution-NoDerivs license, for more details see here
| Reference: Kozlowski LP. Proteome-pI 2.0: Proteome Isoelectric Point Database Update. Nucleic Acids Res. 2021, doi: 10.1093/nar/gkab944 | Contact: Lukasz P. Kozlowski |
