Saccharomonospora sp. LRS4.154
Taxonomy: cellular organisms; Bacteria; Terrabacteria group; Actinobacteria; Actinomycetia; Pseudonocardiales; Pseudonocardiaceae; Saccharomo
Average proteome isoelectric point is 6.14
Get precalculated fractions of proteins

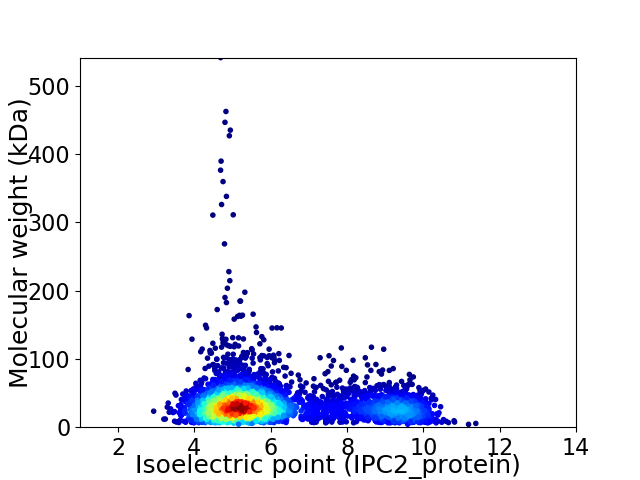
Virtual 2D-PAGE plot for 4456 proteins (isoelectric point calculated using IPC2_protein)
Get csv file with sequences according to given criteria:
* You can choose from 21 different methods for calculating isoelectric point
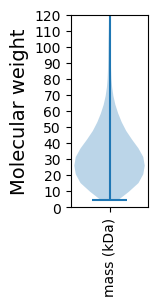
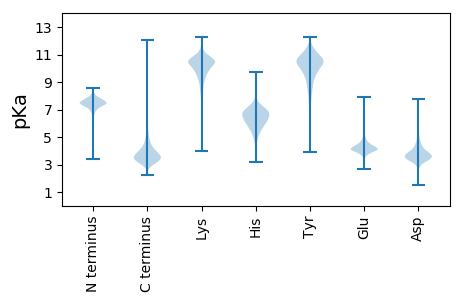
Summary statistics related to proteome-wise predictions


Protein with the lowest isoelectric point:
>tr|A0A1V9A086|A0A1V9A086_9PSEU MarR family transcriptional regulator OS=Saccharomonospora sp. LRS4.154 OX=1962155 GN=B1813_13515 PE=4 SV=1
MM1 pKa = 7.26TVRR4 pKa = 11.84DD5 pKa = 3.85TPYY8 pKa = 10.8PDD10 pKa = 4.5GTPCWVDD17 pKa = 4.25LMVADD22 pKa = 5.05PRR24 pKa = 11.84MAMDD28 pKa = 4.24FYY30 pKa = 11.59GALFGWNFADD40 pKa = 4.88QGDD43 pKa = 3.82EE44 pKa = 3.9AGNYY48 pKa = 8.08LLCSIDD54 pKa = 3.98DD55 pKa = 3.95FVVTGVGGMPPDD67 pKa = 3.74QPSPPVWTTYY77 pKa = 10.8LATSDD82 pKa = 4.0VDD84 pKa = 3.49DD85 pKa = 3.61TAARR89 pKa = 11.84VRR91 pKa = 11.84QAGGQLMVEE100 pKa = 4.47PMDD103 pKa = 3.69VMSEE107 pKa = 3.59GRR109 pKa = 11.84MAMAADD115 pKa = 3.45PTGAVFGLWQAGRR128 pKa = 11.84TIGAQLTGTPSALVWNEE145 pKa = 3.09CMTRR149 pKa = 11.84DD150 pKa = 3.33FATAKK155 pKa = 10.44GFYY158 pKa = 9.64TDD160 pKa = 3.19VFGYY164 pKa = 10.38AAEE167 pKa = 4.65DD168 pKa = 3.46MSDD171 pKa = 3.43EE172 pKa = 4.17QFTYY176 pKa = 10.93AALLVGDD183 pKa = 4.81RR184 pKa = 11.84YY185 pKa = 10.89VGGVGEE191 pKa = 4.96LPADD195 pKa = 3.9VPADD199 pKa = 3.93VPPHH203 pKa = 5.25WMTYY207 pKa = 10.41FGVADD212 pKa = 3.74TDD214 pKa = 3.83AAVARR219 pKa = 11.84VGDD222 pKa = 3.86LGGSVVTAPFDD233 pKa = 3.68TPYY236 pKa = 11.4GRR238 pKa = 11.84MAAVADD244 pKa = 3.9NQGVAFSVIAVTAVPDD260 pKa = 3.69SPEE263 pKa = 3.49
MM1 pKa = 7.26TVRR4 pKa = 11.84DD5 pKa = 3.85TPYY8 pKa = 10.8PDD10 pKa = 4.5GTPCWVDD17 pKa = 4.25LMVADD22 pKa = 5.05PRR24 pKa = 11.84MAMDD28 pKa = 4.24FYY30 pKa = 11.59GALFGWNFADD40 pKa = 4.88QGDD43 pKa = 3.82EE44 pKa = 3.9AGNYY48 pKa = 8.08LLCSIDD54 pKa = 3.98DD55 pKa = 3.95FVVTGVGGMPPDD67 pKa = 3.74QPSPPVWTTYY77 pKa = 10.8LATSDD82 pKa = 4.0VDD84 pKa = 3.49DD85 pKa = 3.61TAARR89 pKa = 11.84VRR91 pKa = 11.84QAGGQLMVEE100 pKa = 4.47PMDD103 pKa = 3.69VMSEE107 pKa = 3.59GRR109 pKa = 11.84MAMAADD115 pKa = 3.45PTGAVFGLWQAGRR128 pKa = 11.84TIGAQLTGTPSALVWNEE145 pKa = 3.09CMTRR149 pKa = 11.84DD150 pKa = 3.33FATAKK155 pKa = 10.44GFYY158 pKa = 9.64TDD160 pKa = 3.19VFGYY164 pKa = 10.38AAEE167 pKa = 4.65DD168 pKa = 3.46MSDD171 pKa = 3.43EE172 pKa = 4.17QFTYY176 pKa = 10.93AALLVGDD183 pKa = 4.81RR184 pKa = 11.84YY185 pKa = 10.89VGGVGEE191 pKa = 4.96LPADD195 pKa = 3.9VPADD199 pKa = 3.93VPPHH203 pKa = 5.25WMTYY207 pKa = 10.41FGVADD212 pKa = 3.74TDD214 pKa = 3.83AAVARR219 pKa = 11.84VGDD222 pKa = 3.86LGGSVVTAPFDD233 pKa = 3.68TPYY236 pKa = 11.4GRR238 pKa = 11.84MAAVADD244 pKa = 3.9NQGVAFSVIAVTAVPDD260 pKa = 3.69SPEE263 pKa = 3.49
Molecular weight: 27.86 kDa
Isoelectric point according different methods:
Protein with the highest isoelectric point:
>tr|A0A1V9A125|A0A1V9A125_9PSEU Non-specific serine/threonine protein kinase OS=Saccharomonospora sp. LRS4.154 OX=1962155 GN=B1813_14430 PE=4 SV=1
MM1 pKa = 7.53SKK3 pKa = 10.53GKK5 pKa = 8.66RR6 pKa = 11.84TFQPNNRR13 pKa = 11.84RR14 pKa = 11.84RR15 pKa = 11.84ARR17 pKa = 11.84THH19 pKa = 5.69GFRR22 pKa = 11.84LRR24 pKa = 11.84MRR26 pKa = 11.84TRR28 pKa = 11.84AGRR31 pKa = 11.84AILAGRR37 pKa = 11.84RR38 pKa = 11.84RR39 pKa = 11.84KK40 pKa = 9.89GRR42 pKa = 11.84ARR44 pKa = 11.84LSAA47 pKa = 3.91
MM1 pKa = 7.53SKK3 pKa = 10.53GKK5 pKa = 8.66RR6 pKa = 11.84TFQPNNRR13 pKa = 11.84RR14 pKa = 11.84RR15 pKa = 11.84ARR17 pKa = 11.84THH19 pKa = 5.69GFRR22 pKa = 11.84LRR24 pKa = 11.84MRR26 pKa = 11.84TRR28 pKa = 11.84AGRR31 pKa = 11.84AILAGRR37 pKa = 11.84RR38 pKa = 11.84RR39 pKa = 11.84KK40 pKa = 9.89GRR42 pKa = 11.84ARR44 pKa = 11.84LSAA47 pKa = 3.91
Molecular weight: 5.53 kDa
Isoelectric point according different methods:
Peptides (in silico digests for buttom-up proteomics)
Below you can find in silico digests of the whole proteome with Trypsin, Chymotrypsin, Trypsin+LysC, LysN, ArgC proteases suitable for different mass spec machines.| Try ESI |
 |
|---|
| ChTry ESI |
 |
|---|
| ArgC ESI |
 |
|---|
| LysN ESI |
 |
|---|
| TryLysC ESI |
 |
|---|
| Try MALDI |
 |
|---|
| ChTry MALDI |
 |
|---|
| ArgC MALDI |
 |
|---|
| LysN MALDI |
 |
|---|
| TryLysC MALDI |
 |
|---|
| Try LTQ |
 |
|---|
| ChTry LTQ |
 |
|---|
| ArgC LTQ |
 |
|---|
| LysN LTQ |
 |
|---|
| TryLysC LTQ |
 |
|---|
| Try MSlow |
 |
|---|
| ChTry MSlow |
 |
|---|
| ArgC MSlow |
 |
|---|
| LysN MSlow |
 |
|---|
| TryLysC MSlow |
 |
|---|
| Try MShigh |
 |
|---|
| ChTry MShigh |
 |
|---|
| ArgC MShigh |
 |
|---|
| LysN MShigh |
 |
|---|
| TryLysC MShigh |
 |
|---|
General Statistics
Number of major isoforms |
Number of additional isoforms |
Number of all proteins |
Number of amino acids |
Min. Seq. Length |
Max. Seq. Length |
Avg. Seq. Length |
Avg. Mol. Weight |
|---|---|---|---|---|---|---|---|
0 |
1458872 |
33 |
5196 |
327.4 |
35.02 |
Amino acid frequency
Ala |
Cys |
Asp |
Glu |
Phe |
Gly |
His |
Ile |
Lys |
Leu |
|---|---|---|---|---|---|---|---|---|---|
13.464 ± 0.056 | 0.753 ± 0.01 |
6.41 ± 0.032 | 5.947 ± 0.035 |
2.686 ± 0.024 | 9.406 ± 0.036 |
2.289 ± 0.016 | 2.865 ± 0.024 |
1.55 ± 0.026 | 10.499 ± 0.042 |
Met |
Asn |
Gln |
Pro |
Arg |
Ser |
Thr |
Val |
Trp |
Tyr |
|---|---|---|---|---|---|---|---|---|---|
1.595 ± 0.014 | 1.637 ± 0.016 |
5.853 ± 0.029 | 2.576 ± 0.024 |
8.386 ± 0.044 | 5.181 ± 0.026 |
6.103 ± 0.026 | 9.391 ± 0.033 |
1.489 ± 0.014 | 1.921 ± 0.019 |
Most of the basic statistics you can see at this page can be downloaded from this CSV file
Proteome-pI is available under Creative Commons Attribution-NoDerivs license, for more details see here
| Reference: Kozlowski LP. Proteome-pI 2.0: Proteome Isoelectric Point Database Update. Nucleic Acids Res. 2021, doi: 10.1093/nar/gkab944 | Contact: Lukasz P. Kozlowski |
