Methanosarcina mazei (strain ATCC BAA-159 / DSM 3647 / Goe1 / Go1 / JCM 11833 / OCM 88) (Methanosarcina frisia)
Taxonomy: cellular organisms; Archaea; Euryarchaeota; Stenosarchaea group; Methanomicrobia; Methanosarcinales; Methanosarcinaceae; Methanosarcina; Methanosarcina mazei
Average proteome isoelectric point is 6.09
Get precalculated fractions of proteins

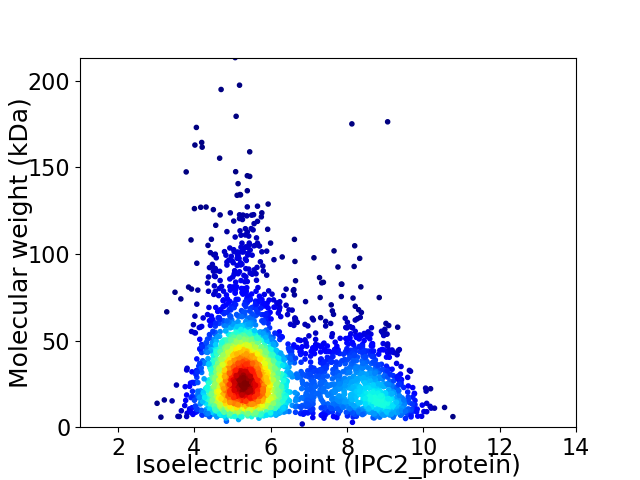
Virtual 2D-PAGE plot for 3303 proteins (isoelectric point calculated using IPC2_protein)
Get csv file with sequences according to given criteria:
* You can choose from 21 different methods for calculating isoelectric point
Summary statistics related to proteome-wise predictions


Protein with the lowest isoelectric point:
>tr|Q8PVK2|Q8PVK2_METMA Uncharacterized protein OS=Methanosarcina mazei (strain ATCC BAA-159 / DSM 3647 / Goe1 / Go1 / JCM 11833 / OCM 88) OX=192952 GN=MM_1961 PE=4 SV=1
MM1 pKa = 7.49KK2 pKa = 10.36KK3 pKa = 10.24SIALISVFAVLMIAFSGCVDD23 pKa = 3.71NSPAVNGTDD32 pKa = 3.28SDD34 pKa = 4.07NPEE37 pKa = 4.23TNPISDD43 pKa = 4.33DD44 pKa = 3.6DD45 pKa = 4.23AAGVSTIEE53 pKa = 3.97NPPAGFEE60 pKa = 4.35YY61 pKa = 10.07IDD63 pKa = 4.65TIPLSTDD70 pKa = 3.51EE71 pKa = 4.55IKK73 pKa = 9.84VTYY76 pKa = 9.47EE77 pKa = 3.78AEE79 pKa = 4.15NVTGILSGSEE89 pKa = 3.82GIYY92 pKa = 9.92RR93 pKa = 11.84DD94 pKa = 3.89SNNTDD99 pKa = 3.41YY100 pKa = 11.41YY101 pKa = 11.01VDD103 pKa = 4.63AIEE106 pKa = 5.45LEE108 pKa = 4.2NEE110 pKa = 3.65EE111 pKa = 4.43AANNLIDD118 pKa = 4.56AYY120 pKa = 10.48RR121 pKa = 11.84SSFPPLSDD129 pKa = 3.08GSRR132 pKa = 11.84FTEE135 pKa = 4.33VSFNGHH141 pKa = 6.07SGVKK145 pKa = 7.67ITDD148 pKa = 3.94YY149 pKa = 9.71ITSGGKK155 pKa = 8.91SVPRR159 pKa = 11.84YY160 pKa = 9.97SYY162 pKa = 9.66IWSNEE167 pKa = 3.42NYY169 pKa = 10.18VIVVFGNTAEE179 pKa = 4.12EE180 pKa = 4.28APVRR184 pKa = 11.84QLAEE188 pKa = 3.84ATGYY192 pKa = 10.63
MM1 pKa = 7.49KK2 pKa = 10.36KK3 pKa = 10.24SIALISVFAVLMIAFSGCVDD23 pKa = 3.71NSPAVNGTDD32 pKa = 3.28SDD34 pKa = 4.07NPEE37 pKa = 4.23TNPISDD43 pKa = 4.33DD44 pKa = 3.6DD45 pKa = 4.23AAGVSTIEE53 pKa = 3.97NPPAGFEE60 pKa = 4.35YY61 pKa = 10.07IDD63 pKa = 4.65TIPLSTDD70 pKa = 3.51EE71 pKa = 4.55IKK73 pKa = 9.84VTYY76 pKa = 9.47EE77 pKa = 3.78AEE79 pKa = 4.15NVTGILSGSEE89 pKa = 3.82GIYY92 pKa = 9.92RR93 pKa = 11.84DD94 pKa = 3.89SNNTDD99 pKa = 3.41YY100 pKa = 11.41YY101 pKa = 11.01VDD103 pKa = 4.63AIEE106 pKa = 5.45LEE108 pKa = 4.2NEE110 pKa = 3.65EE111 pKa = 4.43AANNLIDD118 pKa = 4.56AYY120 pKa = 10.48RR121 pKa = 11.84SSFPPLSDD129 pKa = 3.08GSRR132 pKa = 11.84FTEE135 pKa = 4.33VSFNGHH141 pKa = 6.07SGVKK145 pKa = 7.67ITDD148 pKa = 3.94YY149 pKa = 9.71ITSGGKK155 pKa = 8.91SVPRR159 pKa = 11.84YY160 pKa = 9.97SYY162 pKa = 9.66IWSNEE167 pKa = 3.42NYY169 pKa = 10.18VIVVFGNTAEE179 pKa = 4.12EE180 pKa = 4.28APVRR184 pKa = 11.84QLAEE188 pKa = 3.84ATGYY192 pKa = 10.63
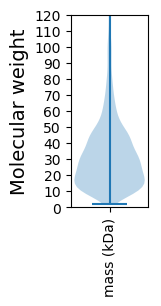
Molecular weight: 20.72 kDa
Isoelectric point according different methods:
Protein with the highest isoelectric point:
>tr|Q8PYR5|Q8PYR5_METMA Inhibitor_I42 domain-containing protein OS=Methanosarcina mazei (strain ATCC BAA-159 / DSM 3647 / Goe1 / Go1 / JCM 11833 / OCM 88) OX=192952 GN=MM_0795 PE=4 SV=1
MM1 pKa = 6.8SHH3 pKa = 6.05NMKK6 pKa = 10.11GQKK9 pKa = 9.42KK10 pKa = 9.38RR11 pKa = 11.84LAKK14 pKa = 10.02AHH16 pKa = 5.94KK17 pKa = 8.8QNSRR21 pKa = 11.84VPVWAIVKK29 pKa = 7.23TNRR32 pKa = 11.84KK33 pKa = 8.7VVSHH37 pKa = 6.09PRR39 pKa = 11.84RR40 pKa = 11.84RR41 pKa = 11.84HH42 pKa = 3.61WRR44 pKa = 11.84RR45 pKa = 11.84GSLDD49 pKa = 3.28VKK51 pKa = 11.03
MM1 pKa = 6.8SHH3 pKa = 6.05NMKK6 pKa = 10.11GQKK9 pKa = 9.42KK10 pKa = 9.38RR11 pKa = 11.84LAKK14 pKa = 10.02AHH16 pKa = 5.94KK17 pKa = 8.8QNSRR21 pKa = 11.84VPVWAIVKK29 pKa = 7.23TNRR32 pKa = 11.84KK33 pKa = 8.7VVSHH37 pKa = 6.09PRR39 pKa = 11.84RR40 pKa = 11.84RR41 pKa = 11.84HH42 pKa = 3.61WRR44 pKa = 11.84RR45 pKa = 11.84GSLDD49 pKa = 3.28VKK51 pKa = 11.03
Molecular weight: 6.1 kDa
Isoelectric point according different methods:
Peptides (in silico digests for buttom-up proteomics)
Below you can find in silico digests of the whole proteome with Trypsin, Chymotrypsin, Trypsin+LysC, LysN, ArgC proteases suitable for different mass spec machines.| Try ESI |
 |
|---|
| ChTry ESI |
 |
|---|
| ArgC ESI |
 |
|---|
| LysN ESI |
 |
|---|
| TryLysC ESI |
 |
|---|
| Try MALDI |
 |
|---|
| ChTry MALDI |
 |
|---|
| ArgC MALDI |
 |
|---|
| LysN MALDI |
 |
|---|
| TryLysC MALDI |
 |
|---|
| Try LTQ |
 |
|---|
| ChTry LTQ |
 |
|---|
| ArgC LTQ |
 |
|---|
| LysN LTQ |
 |
|---|
| TryLysC LTQ |
 |
|---|
| Try MSlow |
 |
|---|
| ChTry MSlow |
 |
|---|
| ArgC MSlow |
 |
|---|
| LysN MSlow |
 |
|---|
| TryLysC MSlow |
 |
|---|
| Try MShigh |
 |
|---|
| ChTry MShigh |
 |
|---|
| ArgC MShigh |
 |
|---|
| LysN MShigh |
 |
|---|
| TryLysC MShigh |
 |
|---|
General Statistics
Number of major isoforms |
Number of additional isoforms |
Number of all proteins |
Number of amino acids |
Min. Seq. Length |
Max. Seq. Length |
Avg. Seq. Length |
Avg. Mol. Weight |
|---|---|---|---|---|---|---|---|
0 |
1004248 |
16 |
1898 |
304.0 |
33.94 |
Amino acid frequency
Ala |
Cys |
Asp |
Glu |
Phe |
Gly |
His |
Ile |
Lys |
Leu |
|---|---|---|---|---|---|---|---|---|---|
7.103 ± 0.05 | 1.236 ± 0.021 |
5.26 ± 0.03 | 8.16 ± 0.057 |
4.296 ± 0.04 | 7.266 ± 0.044 |
1.665 ± 0.017 | 7.656 ± 0.035 |
6.771 ± 0.043 | 9.387 ± 0.053 |
Met |
Asn |
Gln |
Pro |
Arg |
Ser |
Thr |
Val |
Trp |
Tyr |
|---|---|---|---|---|---|---|---|---|---|
2.488 ± 0.023 | 4.339 ± 0.046 |
4.009 ± 0.027 | 2.468 ± 0.023 |
4.652 ± 0.037 | 6.768 ± 0.046 |
5.116 ± 0.038 | 6.894 ± 0.04 |
0.936 ± 0.014 | 3.531 ± 0.03 |
Most of the basic statistics you can see at this page can be downloaded from this CSV file
Proteome-pI is available under Creative Commons Attribution-NoDerivs license, for more details see here
| Reference: Kozlowski LP. Proteome-pI 2.0: Proteome Isoelectric Point Database Update. Nucleic Acids Res. 2021, doi: 10.1093/nar/gkab944 | Contact: Lukasz P. Kozlowski |
