Acrocarpospora pleiomorpha
Taxonomy: cellular organisms; Bacteria; Terrabacteria group; Actinobacteria; Actinomycetia; Streptosporangiales; Streptosporangiaceae; Acrocarpospora
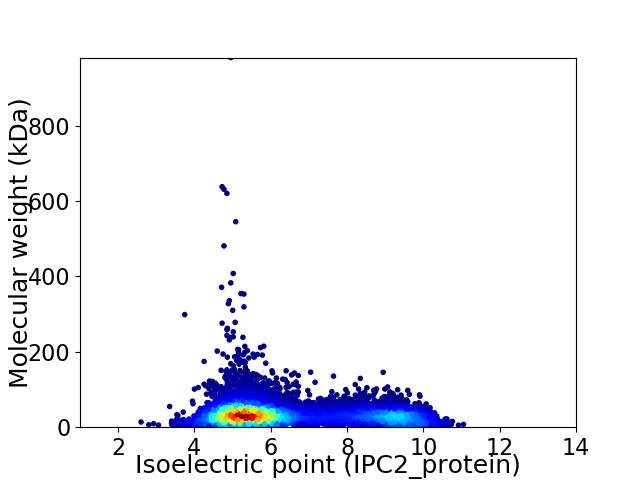
Average proteome isoelectric point is 6.41
Get precalculated fractions of proteins

Virtual 2D-PAGE plot for 10405 proteins (isoelectric point calculated using IPC2_protein)
Get csv file with sequences according to given criteria:
* You can choose from 21 different methods for calculating isoelectric point
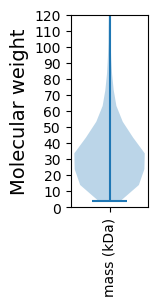
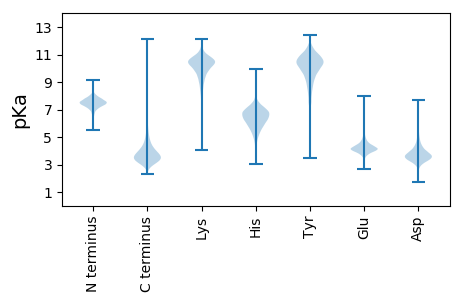
Summary statistics related to proteome-wise predictions


Protein with the lowest isoelectric point:
>tr|A0A5M3XNG9|A0A5M3XNG9_9ACTN Maltose/maltodextrin transport system permease protein OS=Acrocarpospora pleiomorpha OX=90975 GN=Aple_056630 PE=3 SV=1
MM1 pKa = 7.35SALRR5 pKa = 11.84SAAVVAAVLIFSTTIAVAPAYY26 pKa = 10.33AIDD29 pKa = 3.62TNAWVQGGEE38 pKa = 4.18LNYY41 pKa = 9.5TAAPGQVNHH50 pKa = 5.92VVFTRR55 pKa = 11.84TDD57 pKa = 3.18ANTYY61 pKa = 10.45LVDD64 pKa = 5.56DD65 pKa = 4.93IVAITPLEE73 pKa = 4.73GCTHH77 pKa = 6.79PNARR81 pKa = 11.84DD82 pKa = 3.43LTLVQCTAEE91 pKa = 4.29FGFGGQLIVDD101 pKa = 4.18VGDD104 pKa = 4.49LDD106 pKa = 6.36DD107 pKa = 4.61IVNPTGPNHH116 pKa = 6.7ALIGLGSGDD125 pKa = 4.18DD126 pKa = 3.34IAYY129 pKa = 8.7GFPGSVGSLVDD140 pKa = 4.06GGPGDD145 pKa = 4.99DD146 pKa = 5.56LIHH149 pKa = 6.7SGPGQHH155 pKa = 7.09LIDD158 pKa = 5.03GGTGTDD164 pKa = 3.32TVSYY168 pKa = 9.1AARR171 pKa = 11.84VAPVTVDD178 pKa = 5.11LAACPCGEE186 pKa = 4.38AGEE189 pKa = 5.02ADD191 pKa = 3.66TLNGVEE197 pKa = 4.05NVIGGSASDD206 pKa = 3.76TLTGDD211 pKa = 3.55TLANTLTGGGGNDD224 pKa = 3.46VIAGKK229 pKa = 10.44SGADD233 pKa = 3.49TLNGGIGTDD242 pKa = 3.58TLKK245 pKa = 11.21GGWGNDD251 pKa = 3.41TLNGGLGPDD260 pKa = 3.85TLTGGWGNDD269 pKa = 3.23TLTGGLGNDD278 pKa = 3.78TLRR281 pKa = 11.84GGSGNDD287 pKa = 3.46TLNGGVGFADD297 pKa = 4.2DD298 pKa = 4.33CNGGLGADD306 pKa = 3.71VEE308 pKa = 4.8IGCEE312 pKa = 3.82LL313 pKa = 3.63
MM1 pKa = 7.35SALRR5 pKa = 11.84SAAVVAAVLIFSTTIAVAPAYY26 pKa = 10.33AIDD29 pKa = 3.62TNAWVQGGEE38 pKa = 4.18LNYY41 pKa = 9.5TAAPGQVNHH50 pKa = 5.92VVFTRR55 pKa = 11.84TDD57 pKa = 3.18ANTYY61 pKa = 10.45LVDD64 pKa = 5.56DD65 pKa = 4.93IVAITPLEE73 pKa = 4.73GCTHH77 pKa = 6.79PNARR81 pKa = 11.84DD82 pKa = 3.43LTLVQCTAEE91 pKa = 4.29FGFGGQLIVDD101 pKa = 4.18VGDD104 pKa = 4.49LDD106 pKa = 6.36DD107 pKa = 4.61IVNPTGPNHH116 pKa = 6.7ALIGLGSGDD125 pKa = 4.18DD126 pKa = 3.34IAYY129 pKa = 8.7GFPGSVGSLVDD140 pKa = 4.06GGPGDD145 pKa = 4.99DD146 pKa = 5.56LIHH149 pKa = 6.7SGPGQHH155 pKa = 7.09LIDD158 pKa = 5.03GGTGTDD164 pKa = 3.32TVSYY168 pKa = 9.1AARR171 pKa = 11.84VAPVTVDD178 pKa = 5.11LAACPCGEE186 pKa = 4.38AGEE189 pKa = 5.02ADD191 pKa = 3.66TLNGVEE197 pKa = 4.05NVIGGSASDD206 pKa = 3.76TLTGDD211 pKa = 3.55TLANTLTGGGGNDD224 pKa = 3.46VIAGKK229 pKa = 10.44SGADD233 pKa = 3.49TLNGGIGTDD242 pKa = 3.58TLKK245 pKa = 11.21GGWGNDD251 pKa = 3.41TLNGGLGPDD260 pKa = 3.85TLTGGWGNDD269 pKa = 3.23TLTGGLGNDD278 pKa = 3.78TLRR281 pKa = 11.84GGSGNDD287 pKa = 3.46TLNGGVGFADD297 pKa = 4.2DD298 pKa = 4.33CNGGLGADD306 pKa = 3.71VEE308 pKa = 4.8IGCEE312 pKa = 3.82LL313 pKa = 3.63
Molecular weight: 30.8 kDa
Isoelectric point according different methods:
Protein with the highest isoelectric point:
>tr|A0A5M3Y297|A0A5M3Y297_9ACTN NADH-quinone oxidoreductase subunit I OS=Acrocarpospora pleiomorpha OX=90975 GN=nuoI2 PE=3 SV=1
MM1 pKa = 6.9TAAKK5 pKa = 10.21AGVRR9 pKa = 11.84TVSGRR14 pKa = 11.84IAAGKK19 pKa = 9.68AAGTKK24 pKa = 10.06KK25 pKa = 10.37SVAAGRR31 pKa = 11.84AATKK35 pKa = 9.46TAMAKK40 pKa = 9.02TAVAKK45 pKa = 10.43KK46 pKa = 10.27AVVKK50 pKa = 10.65KK51 pKa = 10.49AVAKK55 pKa = 8.94TAAGKK60 pKa = 9.72AAAKK64 pKa = 9.75KK65 pKa = 9.52AAAGGRR71 pKa = 11.84RR72 pKa = 11.84SVGSGGRR79 pKa = 11.84SS80 pKa = 2.98
MM1 pKa = 6.9TAAKK5 pKa = 10.21AGVRR9 pKa = 11.84TVSGRR14 pKa = 11.84IAAGKK19 pKa = 9.68AAGTKK24 pKa = 10.06KK25 pKa = 10.37SVAAGRR31 pKa = 11.84AATKK35 pKa = 9.46TAMAKK40 pKa = 9.02TAVAKK45 pKa = 10.43KK46 pKa = 10.27AVVKK50 pKa = 10.65KK51 pKa = 10.49AVAKK55 pKa = 8.94TAAGKK60 pKa = 9.72AAAKK64 pKa = 9.75KK65 pKa = 9.52AAAGGRR71 pKa = 11.84RR72 pKa = 11.84SVGSGGRR79 pKa = 11.84SS80 pKa = 2.98
Molecular weight: 7.54 kDa
Isoelectric point according different methods:
Peptides (in silico digests for buttom-up proteomics)
Below you can find in silico digests of the whole proteome with Trypsin, Chymotrypsin, Trypsin+LysC, LysN, ArgC proteases suitable for different mass spec machines.| Try ESI |
 |
|---|
| ChTry ESI |
 |
|---|
| ArgC ESI |
 |
|---|
| LysN ESI |
 |
|---|
| TryLysC ESI |
 |
|---|
| Try MALDI |
 |
|---|
| ChTry MALDI |
 |
|---|
| ArgC MALDI |
 |
|---|
| LysN MALDI |
 |
|---|
| TryLysC MALDI |
 |
|---|
| Try LTQ |
 |
|---|
| ChTry LTQ |
 |
|---|
| ArgC LTQ |
 |
|---|
| LysN LTQ |
 |
|---|
| TryLysC LTQ |
 |
|---|
| Try MSlow |
 |
|---|
| ChTry MSlow |
 |
|---|
| ArgC MSlow |
 |
|---|
| LysN MSlow |
 |
|---|
| TryLysC MSlow |
 |
|---|
| Try MShigh |
 |
|---|
| ChTry MShigh |
 |
|---|
| ArgC MShigh |
 |
|---|
| LysN MShigh |
 |
|---|
| TryLysC MShigh |
 |
|---|
General Statistics
Number of major isoforms |
Number of additional isoforms |
Number of all proteins |
Number of amino acids |
Min. Seq. Length |
Max. Seq. Length |
Avg. Seq. Length |
Avg. Mol. Weight |
|---|---|---|---|---|---|---|---|
0 |
3444316 |
39 |
9382 |
331.0 |
35.61 |
Amino acid frequency
Ala |
Cys |
Asp |
Glu |
Phe |
Gly |
His |
Ile |
Lys |
Leu |
|---|---|---|---|---|---|---|---|---|---|
12.904 ± 0.037 | 0.776 ± 0.007 |
5.834 ± 0.02 | 5.476 ± 0.024 |
2.956 ± 0.013 | 9.149 ± 0.024 |
2.206 ± 0.012 | 4.068 ± 0.016 |
2.043 ± 0.017 | 10.53 ± 0.033 |
Met |
Asn |
Gln |
Pro |
Arg |
Ser |
Thr |
Val |
Trp |
Tyr |
|---|---|---|---|---|---|---|---|---|---|
1.881 ± 0.011 | 2.054 ± 0.017 |
5.948 ± 0.021 | 2.842 ± 0.013 |
7.829 ± 0.028 | 5.241 ± 0.018 |
6.054 ± 0.028 | 8.455 ± 0.024 |
1.594 ± 0.01 | 2.16 ± 0.013 |
Most of the basic statistics you can see at this page can be downloaded from this CSV file
Proteome-pI is available under Creative Commons Attribution-NoDerivs license, for more details see here
| Reference: Kozlowski LP. Proteome-pI 2.0: Proteome Isoelectric Point Database Update. Nucleic Acids Res. 2021, doi: 10.1093/nar/gkab944 | Contact: Lukasz P. Kozlowski |
