Enterobacteria phage VT1-Sakai
Taxonomy: Viruses; Duplodnaviria; Heunggongvirae; Uroviricota; Caudoviricetes; Caudovirales; Siphoviridae; unclassified Siphoviridae
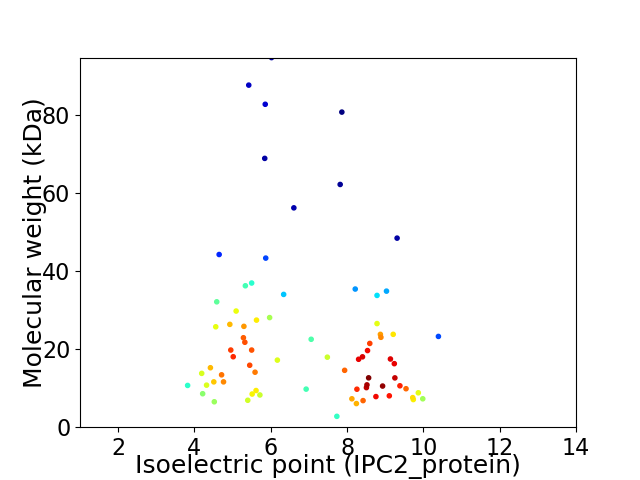
Average proteome isoelectric point is 6.94
Get precalculated fractions of proteins

Virtual 2D-PAGE plot for 77 proteins (isoelectric point calculated using IPC2_protein)
Get csv file with sequences according to given criteria:
* You can choose from 21 different methods for calculating isoelectric point
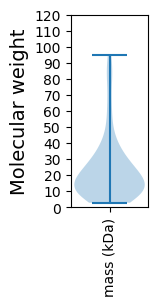
Summary statistics related to proteome-wise predictions


Protein with the lowest isoelectric point:
>tr|Q9EYA9|Q9EYA9_BPVT1 Superinfection exclusion protein B OS=Enterobacteria phage VT1-Sakai OX=462299 GN=sieB PE=4 SV=1
MM1 pKa = 7.47SNIKK5 pKa = 10.19KK6 pKa = 10.63YY7 pKa = 10.7IIDD10 pKa = 4.21YY11 pKa = 9.73DD12 pKa = 3.52WKK14 pKa = 10.79ASIEE18 pKa = 3.99IEE20 pKa = 3.8IDD22 pKa = 3.1HH23 pKa = 7.35DD24 pKa = 4.32VMTEE28 pKa = 3.99EE29 pKa = 5.57KK30 pKa = 10.35LHH32 pKa = 6.08QINNFWSDD40 pKa = 2.68SEE42 pKa = 4.22YY43 pKa = 11.07RR44 pKa = 11.84LNKK47 pKa = 9.52HH48 pKa = 5.94GSVLNAVLIMLAQHH62 pKa = 6.9ALLIAISSDD71 pKa = 2.92LNAYY75 pKa = 9.62GVVCEE80 pKa = 4.87FDD82 pKa = 3.48WNDD85 pKa = 3.26GNGQEE90 pKa = 5.08GWPSMDD96 pKa = 2.65GSEE99 pKa = 4.97GIRR102 pKa = 11.84ITDD105 pKa = 3.36IDD107 pKa = 3.67TSGIFDD113 pKa = 4.38SDD115 pKa = 3.93DD116 pKa = 3.52MTIKK120 pKa = 10.65AAA122 pKa = 3.9
MM1 pKa = 7.47SNIKK5 pKa = 10.19KK6 pKa = 10.63YY7 pKa = 10.7IIDD10 pKa = 4.21YY11 pKa = 9.73DD12 pKa = 3.52WKK14 pKa = 10.79ASIEE18 pKa = 3.99IEE20 pKa = 3.8IDD22 pKa = 3.1HH23 pKa = 7.35DD24 pKa = 4.32VMTEE28 pKa = 3.99EE29 pKa = 5.57KK30 pKa = 10.35LHH32 pKa = 6.08QINNFWSDD40 pKa = 2.68SEE42 pKa = 4.22YY43 pKa = 11.07RR44 pKa = 11.84LNKK47 pKa = 9.52HH48 pKa = 5.94GSVLNAVLIMLAQHH62 pKa = 6.9ALLIAISSDD71 pKa = 2.92LNAYY75 pKa = 9.62GVVCEE80 pKa = 4.87FDD82 pKa = 3.48WNDD85 pKa = 3.26GNGQEE90 pKa = 5.08GWPSMDD96 pKa = 2.65GSEE99 pKa = 4.97GIRR102 pKa = 11.84ITDD105 pKa = 3.36IDD107 pKa = 3.67TSGIFDD113 pKa = 4.38SDD115 pKa = 3.93DD116 pKa = 3.52MTIKK120 pKa = 10.65AAA122 pKa = 3.9
Molecular weight: 13.77 kDa
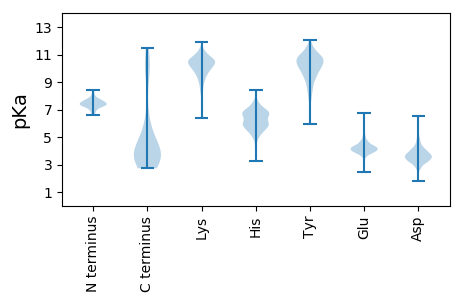
Isoelectric point according different methods:
Protein with the highest isoelectric point:
>tr|Q9EYC1|Q9EYC1_BPVT1 Uncharacterized protein H0042 OS=Enterobacteria phage VT1-Sakai OX=462299 GN=H0042 PE=4 SV=1
MM1 pKa = 6.97STIAEE6 pKa = 4.05LVRR9 pKa = 11.84ANFRR13 pKa = 11.84EE14 pKa = 4.1EE15 pKa = 3.58LVRR18 pKa = 11.84WYY20 pKa = 10.29RR21 pKa = 11.84YY22 pKa = 9.46RR23 pKa = 11.84SSSSLPLDD31 pKa = 3.41EE32 pKa = 6.07LYY34 pKa = 10.73EE35 pKa = 4.16HH36 pKa = 6.91SPAARR41 pKa = 11.84RR42 pKa = 11.84YY43 pKa = 8.71PRR45 pKa = 11.84DD46 pKa = 3.04RR47 pKa = 11.84VLRR50 pKa = 11.84RR51 pKa = 11.84LFKK54 pKa = 11.01LNNEE58 pKa = 4.2FQRR61 pKa = 11.84NRR63 pKa = 11.84IIRR66 pKa = 11.84SLDD69 pKa = 3.3FKK71 pKa = 11.5
MM1 pKa = 6.97STIAEE6 pKa = 4.05LVRR9 pKa = 11.84ANFRR13 pKa = 11.84EE14 pKa = 4.1EE15 pKa = 3.58LVRR18 pKa = 11.84WYY20 pKa = 10.29RR21 pKa = 11.84YY22 pKa = 9.46RR23 pKa = 11.84SSSSLPLDD31 pKa = 3.41EE32 pKa = 6.07LYY34 pKa = 10.73EE35 pKa = 4.16HH36 pKa = 6.91SPAARR41 pKa = 11.84RR42 pKa = 11.84YY43 pKa = 8.71PRR45 pKa = 11.84DD46 pKa = 3.04RR47 pKa = 11.84VLRR50 pKa = 11.84RR51 pKa = 11.84LFKK54 pKa = 11.01LNNEE58 pKa = 4.2FQRR61 pKa = 11.84NRR63 pKa = 11.84IIRR66 pKa = 11.84SLDD69 pKa = 3.3FKK71 pKa = 11.5
Molecular weight: 8.8 kDa
Isoelectric point according different methods:
Peptides (in silico digests for buttom-up proteomics)
Below you can find in silico digests of the whole proteome with Trypsin, Chymotrypsin, Trypsin+LysC, LysN, ArgC proteases suitable for different mass spec machines.| Try ESI |
 |
|---|
| ChTry ESI |
 |
|---|
| ArgC ESI |
 |
|---|
| LysN ESI |
 |
|---|
| TryLysC ESI |
 |
|---|
| Try MALDI |
 |
|---|
| ChTry MALDI |
 |
|---|
| ArgC MALDI |
 |
|---|
| LysN MALDI |
 |
|---|
| TryLysC MALDI |
 |
|---|
| Try LTQ |
 |
|---|
| ChTry LTQ |
 |
|---|
| ArgC LTQ |
 |
|---|
| LysN LTQ |
 |
|---|
| TryLysC LTQ |
 |
|---|
| Try MSlow |
 |
|---|
| ChTry MSlow |
 |
|---|
| ArgC MSlow |
 |
|---|
| LysN MSlow |
 |
|---|
| TryLysC MSlow |
 |
|---|
| Try MShigh |
 |
|---|
| ChTry MShigh |
 |
|---|
| ArgC MShigh |
 |
|---|
| LysN MShigh |
 |
|---|
| TryLysC MShigh |
 |
|---|
General Statistics
Number of major isoforms |
Number of additional isoforms |
Number of all proteins |
Number of amino acids |
Min. Seq. Length |
Max. Seq. Length |
Avg. Seq. Length |
Avg. Mol. Weight |
|---|---|---|---|---|---|---|---|
16249 |
25 |
881 |
211.0 |
23.5 |
Amino acid frequency
Ala |
Cys |
Asp |
Glu |
Phe |
Gly |
His |
Ile |
Lys |
Leu |
|---|---|---|---|---|---|---|---|---|---|
9.939 ± 0.413 | 1.465 ± 0.147 |
5.52 ± 0.208 | 6.493 ± 0.282 |
3.157 ± 0.138 | 7.244 ± 0.342 |
1.803 ± 0.134 | 5.243 ± 0.247 |
5.25 ± 0.325 | 8.45 ± 0.365 |
Met |
Asn |
Gln |
Pro |
Arg |
Ser |
Thr |
Val |
Trp |
Tyr |
|---|---|---|---|---|---|---|---|---|---|
2.831 ± 0.185 | 3.963 ± 0.187 |
4.043 ± 0.267 | 4.259 ± 0.251 |
6.948 ± 0.353 | 6.437 ± 0.219 |
5.73 ± 0.26 | 6.462 ± 0.241 |
2.0 ± 0.157 | 2.763 ± 0.145 |
Most of the basic statistics you can see at this page can be downloaded from this CSV file
Proteome-pI is available under Creative Commons Attribution-NoDerivs license, for more details see here
| Reference: Kozlowski LP. Proteome-pI 2.0: Proteome Isoelectric Point Database Update. Nucleic Acids Res. 2021, doi: 10.1093/nar/gkab944 | Contact: Lukasz P. Kozlowski |
