Catenovulum maritimum
Taxonomy: cellular organisms; Bacteria; Proteobacteria; Gammaproteobacteria; Alteromonadales; Alteromonadaceae; Catenovulum
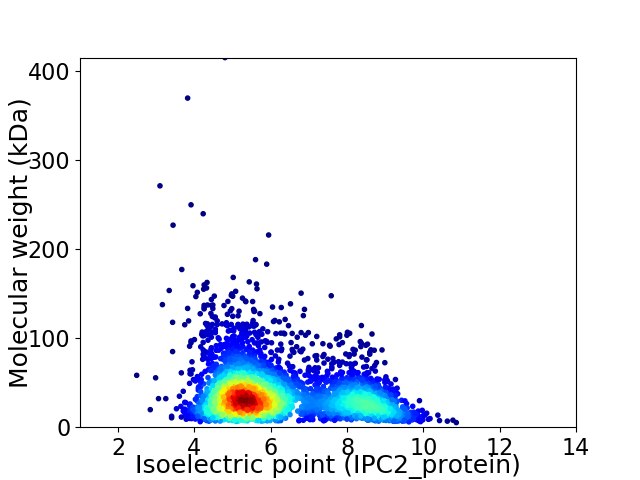
Average proteome isoelectric point is 6.19
Get precalculated fractions of proteins

Virtual 2D-PAGE plot for 3470 proteins (isoelectric point calculated using IPC2_protein)
Get csv file with sequences according to given criteria:
* You can choose from 21 different methods for calculating isoelectric point
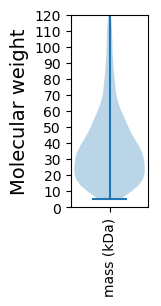
Summary statistics related to proteome-wise predictions


Protein with the lowest isoelectric point:
>tr|A0A0J8GYT1|A0A0J8GYT1_9ALTE Uncharacterized protein OS=Catenovulum maritimum OX=1513271 GN=XM47_06780 PE=4 SV=1
MM1 pKa = 7.65NKK3 pKa = 9.97RR4 pKa = 11.84KK5 pKa = 9.72LLNAAIGTALLTTASFAQADD25 pKa = 4.47MILGLYY31 pKa = 10.49AGGQIWNVEE40 pKa = 4.13PEE42 pKa = 4.12GSFDD46 pKa = 4.5KK47 pKa = 11.52NGDD50 pKa = 3.73DD51 pKa = 3.99FQGSFDD57 pKa = 4.72FDD59 pKa = 4.49SDD61 pKa = 4.12TQGTLYY67 pKa = 10.63VALEE71 pKa = 4.18HH72 pKa = 6.91PIPLIPNVKK81 pKa = 9.71LRR83 pKa = 11.84QTDD86 pKa = 4.06LEE88 pKa = 4.53VKK90 pKa = 9.31GTGEE94 pKa = 3.62ITGEE98 pKa = 4.21LFGQPYY104 pKa = 10.51SGTTNVMGDD113 pKa = 4.39LSHH116 pKa = 7.3TDD118 pKa = 3.0YY119 pKa = 10.98TLYY122 pKa = 11.3YY123 pKa = 9.98EE124 pKa = 4.78IFDD127 pKa = 4.04NGLVSFDD134 pKa = 3.92FGITVKK140 pKa = 10.85DD141 pKa = 3.01IDD143 pKa = 4.94ANIQADD149 pKa = 4.3GEE151 pKa = 4.44SDD153 pKa = 3.14ASSRR157 pKa = 11.84STTNEE162 pKa = 3.65SFSGYY167 pKa = 10.54VPMGYY172 pKa = 9.55VAAEE176 pKa = 3.74IGLPFTGLSVYY187 pKa = 11.1GDD189 pKa = 3.78VNMLAIGDD197 pKa = 4.21HH198 pKa = 6.25SLVDD202 pKa = 3.75YY203 pKa = 10.75QVGVAYY209 pKa = 10.47ALLDD213 pKa = 4.36NIAVDD218 pKa = 4.66LDD220 pKa = 3.7VQLGYY225 pKa = 10.88RR226 pKa = 11.84SFSLKK231 pKa = 10.52LDD233 pKa = 4.15DD234 pKa = 6.15LDD236 pKa = 6.58DD237 pKa = 4.59INTDD241 pKa = 3.38LDD243 pKa = 3.86FSGVYY248 pKa = 10.27AGLEE252 pKa = 3.84VHH254 pKa = 6.97FF255 pKa = 5.33
MM1 pKa = 7.65NKK3 pKa = 9.97RR4 pKa = 11.84KK5 pKa = 9.72LLNAAIGTALLTTASFAQADD25 pKa = 4.47MILGLYY31 pKa = 10.49AGGQIWNVEE40 pKa = 4.13PEE42 pKa = 4.12GSFDD46 pKa = 4.5KK47 pKa = 11.52NGDD50 pKa = 3.73DD51 pKa = 3.99FQGSFDD57 pKa = 4.72FDD59 pKa = 4.49SDD61 pKa = 4.12TQGTLYY67 pKa = 10.63VALEE71 pKa = 4.18HH72 pKa = 6.91PIPLIPNVKK81 pKa = 9.71LRR83 pKa = 11.84QTDD86 pKa = 4.06LEE88 pKa = 4.53VKK90 pKa = 9.31GTGEE94 pKa = 3.62ITGEE98 pKa = 4.21LFGQPYY104 pKa = 10.51SGTTNVMGDD113 pKa = 4.39LSHH116 pKa = 7.3TDD118 pKa = 3.0YY119 pKa = 10.98TLYY122 pKa = 11.3YY123 pKa = 9.98EE124 pKa = 4.78IFDD127 pKa = 4.04NGLVSFDD134 pKa = 3.92FGITVKK140 pKa = 10.85DD141 pKa = 3.01IDD143 pKa = 4.94ANIQADD149 pKa = 4.3GEE151 pKa = 4.44SDD153 pKa = 3.14ASSRR157 pKa = 11.84STTNEE162 pKa = 3.65SFSGYY167 pKa = 10.54VPMGYY172 pKa = 9.55VAAEE176 pKa = 3.74IGLPFTGLSVYY187 pKa = 11.1GDD189 pKa = 3.78VNMLAIGDD197 pKa = 4.21HH198 pKa = 6.25SLVDD202 pKa = 3.75YY203 pKa = 10.75QVGVAYY209 pKa = 10.47ALLDD213 pKa = 4.36NIAVDD218 pKa = 4.66LDD220 pKa = 3.7VQLGYY225 pKa = 10.88RR226 pKa = 11.84SFSLKK231 pKa = 10.52LDD233 pKa = 4.15DD234 pKa = 6.15LDD236 pKa = 6.58DD237 pKa = 4.59INTDD241 pKa = 3.38LDD243 pKa = 3.86FSGVYY248 pKa = 10.27AGLEE252 pKa = 3.84VHH254 pKa = 6.97FF255 pKa = 5.33
Molecular weight: 27.6 kDa
Isoelectric point according different methods:
Protein with the highest isoelectric point:
>tr|A0A0J8JN69|A0A0J8JN69_9ALTE Uncharacterized protein OS=Catenovulum maritimum OX=1513271 GN=XM47_06255 PE=4 SV=1
MM1 pKa = 7.45KK2 pKa = 9.61RR3 pKa = 11.84TFQPSNLKK11 pKa = 10.16RR12 pKa = 11.84KK13 pKa = 9.08RR14 pKa = 11.84NHH16 pKa = 5.37GFRR19 pKa = 11.84ARR21 pKa = 11.84MATKK25 pKa = 10.22SGRR28 pKa = 11.84QILARR33 pKa = 11.84RR34 pKa = 11.84RR35 pKa = 11.84AKK37 pKa = 10.11GRR39 pKa = 11.84KK40 pKa = 8.16EE41 pKa = 3.63LSAA44 pKa = 4.99
MM1 pKa = 7.45KK2 pKa = 9.61RR3 pKa = 11.84TFQPSNLKK11 pKa = 10.16RR12 pKa = 11.84KK13 pKa = 9.08RR14 pKa = 11.84NHH16 pKa = 5.37GFRR19 pKa = 11.84ARR21 pKa = 11.84MATKK25 pKa = 10.22SGRR28 pKa = 11.84QILARR33 pKa = 11.84RR34 pKa = 11.84RR35 pKa = 11.84AKK37 pKa = 10.11GRR39 pKa = 11.84KK40 pKa = 8.16EE41 pKa = 3.63LSAA44 pKa = 4.99
Molecular weight: 5.2 kDa
Isoelectric point according different methods:
Peptides (in silico digests for buttom-up proteomics)
Below you can find in silico digests of the whole proteome with Trypsin, Chymotrypsin, Trypsin+LysC, LysN, ArgC proteases suitable for different mass spec machines.| Try ESI |
 |
|---|
| ChTry ESI |
 |
|---|
| ArgC ESI |
 |
|---|
| LysN ESI |
 |
|---|
| TryLysC ESI |
 |
|---|
| Try MALDI |
 |
|---|
| ChTry MALDI |
 |
|---|
| ArgC MALDI |
 |
|---|
| LysN MALDI |
 |
|---|
| TryLysC MALDI |
 |
|---|
| Try LTQ |
 |
|---|
| ChTry LTQ |
 |
|---|
| ArgC LTQ |
 |
|---|
| LysN LTQ |
 |
|---|
| TryLysC LTQ |
 |
|---|
| Try MSlow |
 |
|---|
| ChTry MSlow |
 |
|---|
| ArgC MSlow |
 |
|---|
| LysN MSlow |
 |
|---|
| TryLysC MSlow |
 |
|---|
| Try MShigh |
 |
|---|
| ChTry MShigh |
 |
|---|
| ArgC MShigh |
 |
|---|
| LysN MShigh |
 |
|---|
| TryLysC MShigh |
 |
|---|
General Statistics
Number of major isoforms |
Number of additional isoforms |
Number of all proteins |
Number of amino acids |
Min. Seq. Length |
Max. Seq. Length |
Avg. Seq. Length |
Avg. Mol. Weight |
|---|---|---|---|---|---|---|---|
0 |
1245000 |
44 |
3740 |
358.8 |
40.03 |
Amino acid frequency
Ala |
Cys |
Asp |
Glu |
Phe |
Gly |
His |
Ile |
Lys |
Leu |
|---|---|---|---|---|---|---|---|---|---|
8.122 ± 0.042 | 0.939 ± 0.012 |
5.756 ± 0.039 | 6.192 ± 0.038 |
4.346 ± 0.024 | 6.243 ± 0.046 |
2.058 ± 0.02 | 6.97 ± 0.032 |
6.199 ± 0.051 | 10.085 ± 0.05 |
Met |
Asn |
Gln |
Pro |
Arg |
Ser |
Thr |
Val |
Trp |
Tyr |
|---|---|---|---|---|---|---|---|---|---|
2.153 ± 0.02 | 5.244 ± 0.037 |
3.621 ± 0.022 | 4.817 ± 0.039 |
3.73 ± 0.023 | 7.037 ± 0.038 |
5.507 ± 0.046 | 6.392 ± 0.04 |
1.253 ± 0.014 | 3.338 ± 0.025 |
Most of the basic statistics you can see at this page can be downloaded from this CSV file
Proteome-pI is available under Creative Commons Attribution-NoDerivs license, for more details see here
| Reference: Kozlowski LP. Proteome-pI 2.0: Proteome Isoelectric Point Database Update. Nucleic Acids Res. 2021, doi: 10.1093/nar/gkab944 | Contact: Lukasz P. Kozlowski |
