Leeuwenhoekiella blandensis (strain CECT 7118 / CCUG 51940 / MED217) (Flavobacterium sp. (strain MED217))
Taxonomy: cellular organisms; Bacteria; FCB group; Bacteroidetes/Chlorobi group; Bacteroidetes; Flavobacteriia; Flavobacteriales; Flavobacteriaceae; Leeuwenhoekiella; Leeuwenhoekiella blandensis
Average proteome isoelectric point is 6.18
Get precalculated fractions of proteins

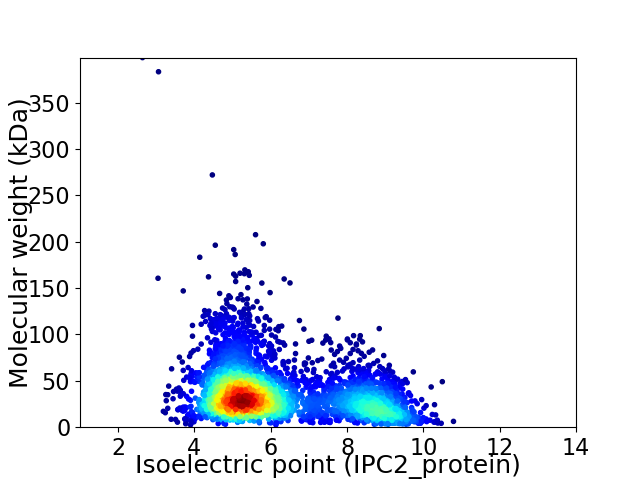
Virtual 2D-PAGE plot for 3687 proteins (isoelectric point calculated using IPC2_protein)
Get csv file with sequences according to given criteria:
* You can choose from 21 different methods for calculating isoelectric point
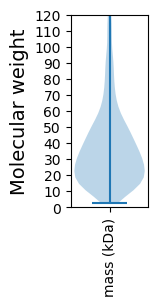
Summary statistics related to proteome-wise predictions


Protein with the lowest isoelectric point:
>tr|A3XJ84|A3XJ84_LEEBM Phosphoheptose isomerase OS=Leeuwenhoekiella blandensis (strain CECT 7118 / CCUG 51940 / MED217) OX=398720 GN=MED217_05157 PE=4 SV=1
MM1 pKa = 7.6KK2 pKa = 10.16KK3 pKa = 10.41LLIAFVCIAGFSFSSQAQDD22 pKa = 2.94IAPNALGLRR31 pKa = 11.84LGDD34 pKa = 3.27SDD36 pKa = 4.76GFGAEE41 pKa = 3.55ISYY44 pKa = 10.25QRR46 pKa = 11.84ALGSNNRR53 pKa = 11.84LEE55 pKa = 4.57LDD57 pKa = 3.4LGIRR61 pKa = 11.84DD62 pKa = 3.65GNNYY66 pKa = 10.67DD67 pKa = 3.65GFKK70 pKa = 10.74LAGLYY75 pKa = 9.28QWVWNIDD82 pKa = 3.55GGFNWYY88 pKa = 10.41AGVGGGLASYY98 pKa = 10.64DD99 pKa = 3.95YY100 pKa = 11.37DD101 pKa = 5.21RR102 pKa = 11.84NDD104 pKa = 3.36YY105 pKa = 11.56DD106 pKa = 5.67DD107 pKa = 4.11DD108 pKa = 4.28TFVFAAGDD116 pKa = 3.24IGIEE120 pKa = 3.99YY121 pKa = 10.6DD122 pKa = 3.5FDD124 pKa = 4.34IPLVLSLDD132 pKa = 3.66FRR134 pKa = 11.84PEE136 pKa = 3.39IGFGDD141 pKa = 3.74GNNYY145 pKa = 9.57YY146 pKa = 11.03DD147 pKa = 5.63NDD149 pKa = 4.34DD150 pKa = 4.27LDD152 pKa = 4.51FDD154 pKa = 3.78IALGIRR160 pKa = 11.84YY161 pKa = 7.87QFF163 pKa = 3.65
MM1 pKa = 7.6KK2 pKa = 10.16KK3 pKa = 10.41LLIAFVCIAGFSFSSQAQDD22 pKa = 2.94IAPNALGLRR31 pKa = 11.84LGDD34 pKa = 3.27SDD36 pKa = 4.76GFGAEE41 pKa = 3.55ISYY44 pKa = 10.25QRR46 pKa = 11.84ALGSNNRR53 pKa = 11.84LEE55 pKa = 4.57LDD57 pKa = 3.4LGIRR61 pKa = 11.84DD62 pKa = 3.65GNNYY66 pKa = 10.67DD67 pKa = 3.65GFKK70 pKa = 10.74LAGLYY75 pKa = 9.28QWVWNIDD82 pKa = 3.55GGFNWYY88 pKa = 10.41AGVGGGLASYY98 pKa = 10.64DD99 pKa = 3.95YY100 pKa = 11.37DD101 pKa = 5.21RR102 pKa = 11.84NDD104 pKa = 3.36YY105 pKa = 11.56DD106 pKa = 5.67DD107 pKa = 4.11DD108 pKa = 4.28TFVFAAGDD116 pKa = 3.24IGIEE120 pKa = 3.99YY121 pKa = 10.6DD122 pKa = 3.5FDD124 pKa = 4.34IPLVLSLDD132 pKa = 3.66FRR134 pKa = 11.84PEE136 pKa = 3.39IGFGDD141 pKa = 3.74GNNYY145 pKa = 9.57YY146 pKa = 11.03DD147 pKa = 5.63NDD149 pKa = 4.34DD150 pKa = 4.27LDD152 pKa = 4.51FDD154 pKa = 3.78IALGIRR160 pKa = 11.84YY161 pKa = 7.87QFF163 pKa = 3.65
Molecular weight: 18.1 kDa
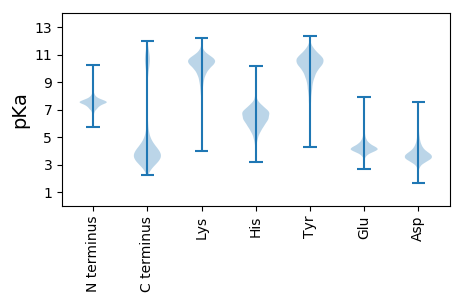
Isoelectric point according different methods:
Protein with the highest isoelectric point:
>tr|A3XMM6|A3XMM6_LEEBM 30S ribosomal protein S1 OS=Leeuwenhoekiella blandensis (strain CECT 7118 / CCUG 51940 / MED217) OX=398720 GN=MED217_07311 PE=4 SV=1
MM1 pKa = 7.45KK2 pKa = 9.59RR3 pKa = 11.84TFQPSKK9 pKa = 9.13RR10 pKa = 11.84KK11 pKa = 9.48RR12 pKa = 11.84RR13 pKa = 11.84NKK15 pKa = 9.49HH16 pKa = 3.94GFRR19 pKa = 11.84EE20 pKa = 4.27RR21 pKa = 11.84MASANGRR28 pKa = 11.84KK29 pKa = 9.04VLARR33 pKa = 11.84RR34 pKa = 11.84RR35 pKa = 11.84AKK37 pKa = 9.29GRR39 pKa = 11.84KK40 pKa = 8.32RR41 pKa = 11.84ISVSSEE47 pKa = 3.46LRR49 pKa = 11.84HH50 pKa = 6.16KK51 pKa = 10.53KK52 pKa = 10.04
MM1 pKa = 7.45KK2 pKa = 9.59RR3 pKa = 11.84TFQPSKK9 pKa = 9.13RR10 pKa = 11.84KK11 pKa = 9.48RR12 pKa = 11.84RR13 pKa = 11.84NKK15 pKa = 9.49HH16 pKa = 3.94GFRR19 pKa = 11.84EE20 pKa = 4.27RR21 pKa = 11.84MASANGRR28 pKa = 11.84KK29 pKa = 9.04VLARR33 pKa = 11.84RR34 pKa = 11.84RR35 pKa = 11.84AKK37 pKa = 9.29GRR39 pKa = 11.84KK40 pKa = 8.32RR41 pKa = 11.84ISVSSEE47 pKa = 3.46LRR49 pKa = 11.84HH50 pKa = 6.16KK51 pKa = 10.53KK52 pKa = 10.04
Molecular weight: 6.27 kDa
Isoelectric point according different methods:
Peptides (in silico digests for buttom-up proteomics)
Below you can find in silico digests of the whole proteome with Trypsin, Chymotrypsin, Trypsin+LysC, LysN, ArgC proteases suitable for different mass spec machines.| Try ESI |
 |
|---|
| ChTry ESI |
 |
|---|
| ArgC ESI |
 |
|---|
| LysN ESI |
 |
|---|
| TryLysC ESI |
 |
|---|
| Try MALDI |
 |
|---|
| ChTry MALDI |
 |
|---|
| ArgC MALDI |
 |
|---|
| LysN MALDI |
 |
|---|
| TryLysC MALDI |
 |
|---|
| Try LTQ |
 |
|---|
| ChTry LTQ |
 |
|---|
| ArgC LTQ |
 |
|---|
| LysN LTQ |
 |
|---|
| TryLysC LTQ |
 |
|---|
| Try MSlow |
 |
|---|
| ChTry MSlow |
 |
|---|
| ArgC MSlow |
 |
|---|
| LysN MSlow |
 |
|---|
| TryLysC MSlow |
 |
|---|
| Try MShigh |
 |
|---|
| ChTry MShigh |
 |
|---|
| ArgC MShigh |
 |
|---|
| LysN MShigh |
 |
|---|
| TryLysC MShigh |
 |
|---|
General Statistics
Number of major isoforms |
Number of additional isoforms |
Number of all proteins |
Number of amino acids |
Min. Seq. Length |
Max. Seq. Length |
Avg. Seq. Length |
Avg. Mol. Weight |
|---|---|---|---|---|---|---|---|
0 |
1268469 |
21 |
3863 |
344.0 |
38.71 |
Amino acid frequency
Ala |
Cys |
Asp |
Glu |
Phe |
Gly |
His |
Ile |
Lys |
Leu |
|---|---|---|---|---|---|---|---|---|---|
7.431 ± 0.041 | 0.66 ± 0.011 |
5.753 ± 0.036 | 6.968 ± 0.039 |
5.078 ± 0.031 | 6.52 ± 0.045 |
1.767 ± 0.022 | 7.003 ± 0.033 |
6.877 ± 0.057 | 9.657 ± 0.042 |
Met |
Asn |
Gln |
Pro |
Arg |
Ser |
Thr |
Val |
Trp |
Tyr |
|---|---|---|---|---|---|---|---|---|---|
2.114 ± 0.02 | 5.456 ± 0.037 |
3.58 ± 0.022 | 3.835 ± 0.025 |
3.804 ± 0.031 | 6.185 ± 0.031 |
5.86 ± 0.05 | 6.226 ± 0.037 |
1.093 ± 0.014 | 4.134 ± 0.026 |
Most of the basic statistics you can see at this page can be downloaded from this CSV file
Proteome-pI is available under Creative Commons Attribution-NoDerivs license, for more details see here
| Reference: Kozlowski LP. Proteome-pI 2.0: Proteome Isoelectric Point Database Update. Nucleic Acids Res. 2021, doi: 10.1093/nar/gkab944 | Contact: Lukasz P. Kozlowski |
