Natronolimnohabitans innermongolicus JCM 12255
Taxonomy: cellular organisms; Archaea; Euryarchaeota; Stenosarchaea group; Halobacteria; Natrialbales; Natrialbaceae; Natronolimnohabitans; Natronolimnohabitans innermongolicus
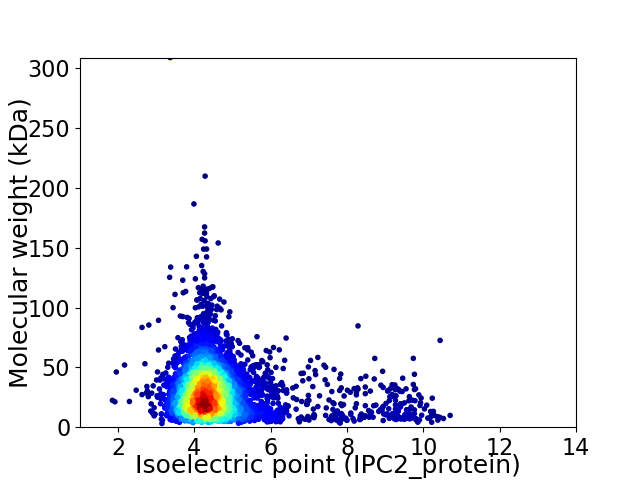
Average proteome isoelectric point is 4.76
Get precalculated fractions of proteins

Virtual 2D-PAGE plot for 4400 proteins (isoelectric point calculated using IPC2_protein)
Get csv file with sequences according to given criteria:
* You can choose from 21 different methods for calculating isoelectric point
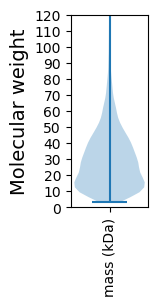
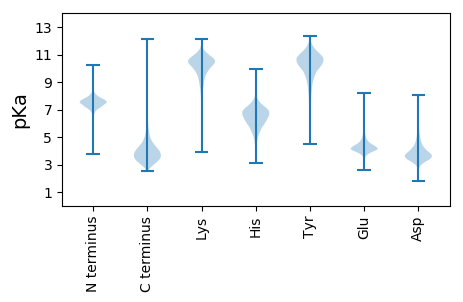
Summary statistics related to proteome-wise predictions


Protein with the lowest isoelectric point:
>tr|L9WKT0|L9WKT0_9EURY Uncharacterized protein OS=Natronolimnohabitans innermongolicus JCM 12255 OX=1227499 GN=C493_19771 PE=4 SV=1
MM1 pKa = 7.01ATAATSLGLVGSASAQDD18 pKa = 3.64DD19 pKa = 4.45YY20 pKa = 11.98EE21 pKa = 4.59VIEE24 pKa = 4.94ASGQSITVADD34 pKa = 4.06GEE36 pKa = 4.43SWEE39 pKa = 4.34NKK41 pKa = 9.78LIDD44 pKa = 3.76MTTGQDD50 pKa = 3.41VSITTTGSDD59 pKa = 2.77WTIRR63 pKa = 11.84NVGFHH68 pKa = 6.16GRR70 pKa = 11.84NEE72 pKa = 4.35SGAGTATFAISDD84 pKa = 3.8AGGEE88 pKa = 4.22STIEE92 pKa = 3.69NVYY95 pKa = 10.83LGDD98 pKa = 4.71GSDD101 pKa = 4.15DD102 pKa = 4.06RR103 pKa = 11.84NGSSTGHH110 pKa = 6.02GQTAFWVNPDD120 pKa = 3.48HH121 pKa = 7.21AGHH124 pKa = 7.42IDD126 pKa = 3.54MQNVNIQGFADD137 pKa = 3.51NAVYY141 pKa = 10.46GSAPGNGGGGTIHH154 pKa = 7.32IDD156 pKa = 3.02SCFAANCYY164 pKa = 9.69VSHH167 pKa = 7.0FRR169 pKa = 11.84LATEE173 pKa = 4.74GSKK176 pKa = 8.69VTNSSILVDD185 pKa = 3.67DD186 pKa = 4.35EE187 pKa = 5.48GYY189 pKa = 10.76AGRR192 pKa = 11.84GIWAWAPGTIEE203 pKa = 4.79VEE205 pKa = 3.97NCQIEE210 pKa = 4.48MNGNHH215 pKa = 5.55TAIDD219 pKa = 3.57AGANGQGTQVVVADD233 pKa = 3.85TDD235 pKa = 3.69YY236 pKa = 11.85DD237 pKa = 3.89EE238 pKa = 4.35QAGIAEE244 pKa = 4.38HH245 pKa = 6.73AGSNVQLEE253 pKa = 4.78GDD255 pKa = 3.6TGTDD259 pKa = 3.4PEE261 pKa = 5.28AIIPDD266 pKa = 4.05GTPTSAEE273 pKa = 3.61AAAAGDD279 pKa = 4.01DD280 pKa = 3.62
MM1 pKa = 7.01ATAATSLGLVGSASAQDD18 pKa = 3.64DD19 pKa = 4.45YY20 pKa = 11.98EE21 pKa = 4.59VIEE24 pKa = 4.94ASGQSITVADD34 pKa = 4.06GEE36 pKa = 4.43SWEE39 pKa = 4.34NKK41 pKa = 9.78LIDD44 pKa = 3.76MTTGQDD50 pKa = 3.41VSITTTGSDD59 pKa = 2.77WTIRR63 pKa = 11.84NVGFHH68 pKa = 6.16GRR70 pKa = 11.84NEE72 pKa = 4.35SGAGTATFAISDD84 pKa = 3.8AGGEE88 pKa = 4.22STIEE92 pKa = 3.69NVYY95 pKa = 10.83LGDD98 pKa = 4.71GSDD101 pKa = 4.15DD102 pKa = 4.06RR103 pKa = 11.84NGSSTGHH110 pKa = 6.02GQTAFWVNPDD120 pKa = 3.48HH121 pKa = 7.21AGHH124 pKa = 7.42IDD126 pKa = 3.54MQNVNIQGFADD137 pKa = 3.51NAVYY141 pKa = 10.46GSAPGNGGGGTIHH154 pKa = 7.32IDD156 pKa = 3.02SCFAANCYY164 pKa = 9.69VSHH167 pKa = 7.0FRR169 pKa = 11.84LATEE173 pKa = 4.74GSKK176 pKa = 8.69VTNSSILVDD185 pKa = 3.67DD186 pKa = 4.35EE187 pKa = 5.48GYY189 pKa = 10.76AGRR192 pKa = 11.84GIWAWAPGTIEE203 pKa = 4.79VEE205 pKa = 3.97NCQIEE210 pKa = 4.48MNGNHH215 pKa = 5.55TAIDD219 pKa = 3.57AGANGQGTQVVVADD233 pKa = 3.85TDD235 pKa = 3.69YY236 pKa = 11.85DD237 pKa = 3.89EE238 pKa = 4.35QAGIAEE244 pKa = 4.38HH245 pKa = 6.73AGSNVQLEE253 pKa = 4.78GDD255 pKa = 3.6TGTDD259 pKa = 3.4PEE261 pKa = 5.28AIIPDD266 pKa = 4.05GTPTSAEE273 pKa = 3.61AAAAGDD279 pKa = 4.01DD280 pKa = 3.62
Molecular weight: 28.62 kDa
Isoelectric point according different methods:
Protein with the highest isoelectric point:
>tr|L9WTT5|L9WTT5_9EURY Gas vesicle structural protein OS=Natronolimnohabitans innermongolicus JCM 12255 OX=1227499 GN=gvpA PE=3 SV=1
MM1 pKa = 7.42SVLGLRR7 pKa = 11.84PRR9 pKa = 11.84VKK11 pKa = 10.5AALLWGAVGSMAFLVLVQGYY31 pKa = 9.83ALLVDD36 pKa = 4.41PLVSLARR43 pKa = 11.84GAAIAVLVGAMTTGCAYY60 pKa = 10.63RR61 pKa = 11.84LEE63 pKa = 4.35HH64 pKa = 7.15RR65 pKa = 11.84VAEE68 pKa = 4.32WAARR72 pKa = 11.84RR73 pKa = 11.84ARR75 pKa = 11.84RR76 pKa = 11.84GDD78 pKa = 3.33EE79 pKa = 3.87SHH81 pKa = 6.72GVDD84 pKa = 4.3GKK86 pKa = 11.32SKK88 pKa = 10.54SS89 pKa = 3.38
MM1 pKa = 7.42SVLGLRR7 pKa = 11.84PRR9 pKa = 11.84VKK11 pKa = 10.5AALLWGAVGSMAFLVLVQGYY31 pKa = 9.83ALLVDD36 pKa = 4.41PLVSLARR43 pKa = 11.84GAAIAVLVGAMTTGCAYY60 pKa = 10.63RR61 pKa = 11.84LEE63 pKa = 4.35HH64 pKa = 7.15RR65 pKa = 11.84VAEE68 pKa = 4.32WAARR72 pKa = 11.84RR73 pKa = 11.84ARR75 pKa = 11.84RR76 pKa = 11.84GDD78 pKa = 3.33EE79 pKa = 3.87SHH81 pKa = 6.72GVDD84 pKa = 4.3GKK86 pKa = 11.32SKK88 pKa = 10.54SS89 pKa = 3.38
Molecular weight: 9.4 kDa
Isoelectric point according different methods:
Peptides (in silico digests for buttom-up proteomics)
Below you can find in silico digests of the whole proteome with Trypsin, Chymotrypsin, Trypsin+LysC, LysN, ArgC proteases suitable for different mass spec machines.| Try ESI |
 |
|---|
| ChTry ESI |
 |
|---|
| ArgC ESI |
 |
|---|
| LysN ESI |
 |
|---|
| TryLysC ESI |
 |
|---|
| Try MALDI |
 |
|---|
| ChTry MALDI |
 |
|---|
| ArgC MALDI |
 |
|---|
| LysN MALDI |
 |
|---|
| TryLysC MALDI |
 |
|---|
| Try LTQ |
 |
|---|
| ChTry LTQ |
 |
|---|
| ArgC LTQ |
 |
|---|
| LysN LTQ |
 |
|---|
| TryLysC LTQ |
 |
|---|
| Try MSlow |
 |
|---|
| ChTry MSlow |
 |
|---|
| ArgC MSlow |
 |
|---|
| LysN MSlow |
 |
|---|
| TryLysC MSlow |
 |
|---|
| Try MShigh |
 |
|---|
| ChTry MShigh |
 |
|---|
| ArgC MShigh |
 |
|---|
| LysN MShigh |
 |
|---|
| TryLysC MShigh |
 |
|---|
General Statistics
Number of major isoforms |
Number of additional isoforms |
Number of all proteins |
Number of amino acids |
Min. Seq. Length |
Max. Seq. Length |
Avg. Seq. Length |
Avg. Mol. Weight |
|---|---|---|---|---|---|---|---|
0 |
1253988 |
28 |
2952 |
285.0 |
31.03 |
Amino acid frequency
Ala |
Cys |
Asp |
Glu |
Phe |
Gly |
His |
Ile |
Lys |
Leu |
|---|---|---|---|---|---|---|---|---|---|
10.782 ± 0.055 | 0.755 ± 0.011 |
8.99 ± 0.053 | 9.283 ± 0.053 |
3.208 ± 0.022 | 8.294 ± 0.034 |
1.964 ± 0.017 | 4.295 ± 0.029 |
1.632 ± 0.022 | 8.909 ± 0.044 |
Met |
Asn |
Gln |
Pro |
Arg |
Ser |
Thr |
Val |
Trp |
Tyr |
|---|---|---|---|---|---|---|---|---|---|
1.689 ± 0.017 | 2.193 ± 0.021 |
4.542 ± 0.026 | 2.364 ± 0.024 |
6.546 ± 0.039 | 5.571 ± 0.034 |
6.431 ± 0.027 | 8.747 ± 0.037 |
1.115 ± 0.014 | 2.687 ± 0.019 |
Most of the basic statistics you can see at this page can be downloaded from this CSV file
Proteome-pI is available under Creative Commons Attribution-NoDerivs license, for more details see here
| Reference: Kozlowski LP. Proteome-pI 2.0: Proteome Isoelectric Point Database Update. Nucleic Acids Res. 2021, doi: 10.1093/nar/gkab944 | Contact: Lukasz P. Kozlowski |
