Ulvibacterium marinum
Taxonomy: cellular organisms; Bacteria; FCB group; Bacteroidetes/Chlorobi group; Bacteroidetes; Flavobacteriia; Flavobacteriales; Flavobacteriaceae; Ulvibacterium
Average proteome isoelectric point is 6.48
Get precalculated fractions of proteins

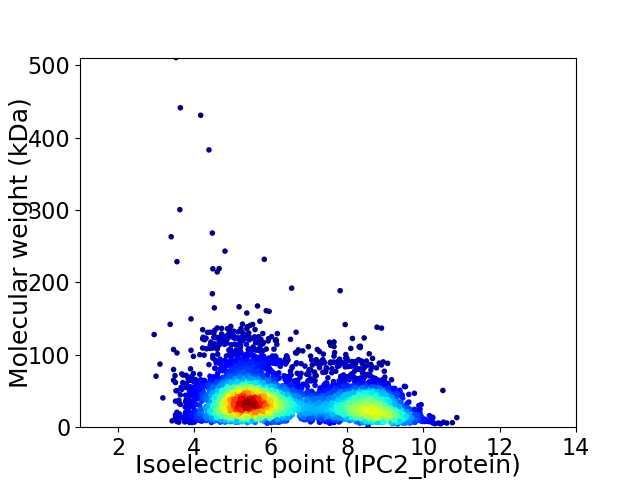
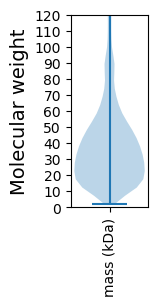
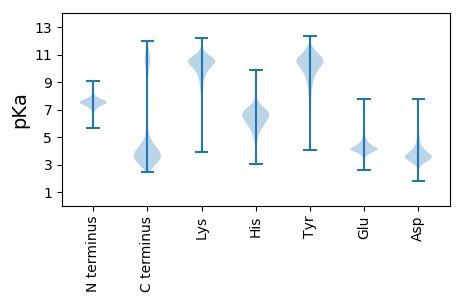
Virtual 2D-PAGE plot for 5010 proteins (isoelectric point calculated using IPC2_protein)
Get csv file with sequences according to given criteria:
* You can choose from 21 different methods for calculating isoelectric point
Summary statistics related to proteome-wise predictions


Protein with the lowest isoelectric point:
>tr|A0A3B0C918|A0A3B0C918_9FLAO M23 family metallopeptidase OS=Ulvibacterium marinum OX=2419782 GN=D7Z94_02785 PE=4 SV=1
MM1 pKa = 7.0YY2 pKa = 9.75RR3 pKa = 11.84YY4 pKa = 10.02DD5 pKa = 5.62AIDD8 pKa = 3.1IMNFKK13 pKa = 9.96VKK15 pKa = 10.52VMFKK19 pKa = 10.46RR20 pKa = 11.84NTWGLIIWSTILLIGLGSCDD40 pKa = 3.5SDD42 pKa = 4.08DD43 pKa = 4.17NAVADD48 pKa = 3.99IPFTADD54 pKa = 2.48VFNSVNGRR62 pKa = 11.84QVAFQGITNNAVSWSWDD79 pKa = 3.35FGDD82 pKa = 4.99GNTSTSQNPVHH93 pKa = 7.09RR94 pKa = 11.84YY95 pKa = 10.09AEE97 pKa = 4.13GGYY100 pKa = 10.03YY101 pKa = 10.11VATLTATDD109 pKa = 3.89EE110 pKa = 4.32NGATLTSEE118 pKa = 4.06VSLALDD124 pKa = 4.02LPPYY128 pKa = 10.48ALLVGNQTEE137 pKa = 4.0EE138 pKa = 5.05GYY140 pKa = 10.52DD141 pKa = 3.31GKK143 pKa = 8.55TWRR146 pKa = 11.84ISSEE150 pKa = 3.72HH151 pKa = 6.14SAFDD155 pKa = 3.46YY156 pKa = 10.88FAFSDD161 pKa = 3.77ADD163 pKa = 3.58LTLFDD168 pKa = 4.72GTPAPLPAGIFGSGLGMGEE187 pKa = 4.02IYY189 pKa = 10.6NDD191 pKa = 3.06EE192 pKa = 3.97FTFYY196 pKa = 11.07FDD198 pKa = 4.42GSYY201 pKa = 11.45KK202 pKa = 9.64MDD204 pKa = 3.74LKK206 pKa = 11.14EE207 pKa = 5.32DD208 pKa = 3.45GTAFSGLVFQFLSFGGANIRR228 pKa = 11.84NLGGEE233 pKa = 4.16DD234 pKa = 4.22FGLCTAAYY242 pKa = 8.15TPAEE246 pKa = 4.3DD247 pKa = 3.38ATFTFTEE254 pKa = 4.44SEE256 pKa = 4.21DD257 pKa = 3.6MTTTSAFGPGGMITYY272 pKa = 9.96EE273 pKa = 4.26GVTTLDD279 pKa = 3.35FSGTEE284 pKa = 4.62FVGFWDD290 pKa = 4.05YY291 pKa = 11.42EE292 pKa = 4.34NKK294 pKa = 10.23VILQDD299 pKa = 3.39ITNSTMRR306 pKa = 11.84LVVFVAASPDD316 pKa = 3.48VPGINTNAIILTFEE330 pKa = 4.33AVDD333 pKa = 3.37
MM1 pKa = 7.0YY2 pKa = 9.75RR3 pKa = 11.84YY4 pKa = 10.02DD5 pKa = 5.62AIDD8 pKa = 3.1IMNFKK13 pKa = 9.96VKK15 pKa = 10.52VMFKK19 pKa = 10.46RR20 pKa = 11.84NTWGLIIWSTILLIGLGSCDD40 pKa = 3.5SDD42 pKa = 4.08DD43 pKa = 4.17NAVADD48 pKa = 3.99IPFTADD54 pKa = 2.48VFNSVNGRR62 pKa = 11.84QVAFQGITNNAVSWSWDD79 pKa = 3.35FGDD82 pKa = 4.99GNTSTSQNPVHH93 pKa = 7.09RR94 pKa = 11.84YY95 pKa = 10.09AEE97 pKa = 4.13GGYY100 pKa = 10.03YY101 pKa = 10.11VATLTATDD109 pKa = 3.89EE110 pKa = 4.32NGATLTSEE118 pKa = 4.06VSLALDD124 pKa = 4.02LPPYY128 pKa = 10.48ALLVGNQTEE137 pKa = 4.0EE138 pKa = 5.05GYY140 pKa = 10.52DD141 pKa = 3.31GKK143 pKa = 8.55TWRR146 pKa = 11.84ISSEE150 pKa = 3.72HH151 pKa = 6.14SAFDD155 pKa = 3.46YY156 pKa = 10.88FAFSDD161 pKa = 3.77ADD163 pKa = 3.58LTLFDD168 pKa = 4.72GTPAPLPAGIFGSGLGMGEE187 pKa = 4.02IYY189 pKa = 10.6NDD191 pKa = 3.06EE192 pKa = 3.97FTFYY196 pKa = 11.07FDD198 pKa = 4.42GSYY201 pKa = 11.45KK202 pKa = 9.64MDD204 pKa = 3.74LKK206 pKa = 11.14EE207 pKa = 5.32DD208 pKa = 3.45GTAFSGLVFQFLSFGGANIRR228 pKa = 11.84NLGGEE233 pKa = 4.16DD234 pKa = 4.22FGLCTAAYY242 pKa = 8.15TPAEE246 pKa = 4.3DD247 pKa = 3.38ATFTFTEE254 pKa = 4.44SEE256 pKa = 4.21DD257 pKa = 3.6MTTTSAFGPGGMITYY272 pKa = 9.96EE273 pKa = 4.26GVTTLDD279 pKa = 3.35FSGTEE284 pKa = 4.62FVGFWDD290 pKa = 4.05YY291 pKa = 11.42EE292 pKa = 4.34NKK294 pKa = 10.23VILQDD299 pKa = 3.39ITNSTMRR306 pKa = 11.84LVVFVAASPDD316 pKa = 3.48VPGINTNAIILTFEE330 pKa = 4.33AVDD333 pKa = 3.37
Molecular weight: 36.23 kDa
Isoelectric point according different methods:
Protein with the highest isoelectric point:
>tr|A0A3B0CAU5|A0A3B0CAU5_9FLAO Peptidase M14 OS=Ulvibacterium marinum OX=2419782 GN=D7Z94_09135 PE=4 SV=1
MM1 pKa = 7.45KK2 pKa = 9.59RR3 pKa = 11.84TFQPSKK9 pKa = 9.13RR10 pKa = 11.84KK11 pKa = 9.48RR12 pKa = 11.84RR13 pKa = 11.84NKK15 pKa = 9.49HH16 pKa = 3.94GFRR19 pKa = 11.84EE20 pKa = 4.19RR21 pKa = 11.84MATANGRR28 pKa = 11.84KK29 pKa = 8.93VLARR33 pKa = 11.84RR34 pKa = 11.84RR35 pKa = 11.84AKK37 pKa = 10.09GRR39 pKa = 11.84KK40 pKa = 7.97KK41 pKa = 10.52LSVSSEE47 pKa = 3.87PRR49 pKa = 11.84HH50 pKa = 5.92KK51 pKa = 10.61KK52 pKa = 9.84
MM1 pKa = 7.45KK2 pKa = 9.59RR3 pKa = 11.84TFQPSKK9 pKa = 9.13RR10 pKa = 11.84KK11 pKa = 9.48RR12 pKa = 11.84RR13 pKa = 11.84NKK15 pKa = 9.49HH16 pKa = 3.94GFRR19 pKa = 11.84EE20 pKa = 4.19RR21 pKa = 11.84MATANGRR28 pKa = 11.84KK29 pKa = 8.93VLARR33 pKa = 11.84RR34 pKa = 11.84RR35 pKa = 11.84AKK37 pKa = 10.09GRR39 pKa = 11.84KK40 pKa = 7.97KK41 pKa = 10.52LSVSSEE47 pKa = 3.87PRR49 pKa = 11.84HH50 pKa = 5.92KK51 pKa = 10.61KK52 pKa = 9.84
Molecular weight: 6.24 kDa
Isoelectric point according different methods:
Peptides (in silico digests for buttom-up proteomics)
Below you can find in silico digests of the whole proteome with Trypsin, Chymotrypsin, Trypsin+LysC, LysN, ArgC proteases suitable for different mass spec machines.| Try ESI |
 |
|---|
| ChTry ESI |
 |
|---|
| ArgC ESI |
 |
|---|
| LysN ESI |
 |
|---|
| TryLysC ESI |
 |
|---|
| Try MALDI |
 |
|---|
| ChTry MALDI |
 |
|---|
| ArgC MALDI |
 |
|---|
| LysN MALDI |
 |
|---|
| TryLysC MALDI |
 |
|---|
| Try LTQ |
 |
|---|
| ChTry LTQ |
 |
|---|
| ArgC LTQ |
 |
|---|
| LysN LTQ |
 |
|---|
| TryLysC LTQ |
 |
|---|
| Try MSlow |
 |
|---|
| ChTry MSlow |
 |
|---|
| ArgC MSlow |
 |
|---|
| LysN MSlow |
 |
|---|
| TryLysC MSlow |
 |
|---|
| Try MShigh |
 |
|---|
| ChTry MShigh |
 |
|---|
| ArgC MShigh |
 |
|---|
| LysN MShigh |
 |
|---|
| TryLysC MShigh |
 |
|---|
General Statistics
Number of major isoforms |
Number of additional isoforms |
Number of all proteins |
Number of amino acids |
Min. Seq. Length |
Max. Seq. Length |
Avg. Seq. Length |
Avg. Mol. Weight |
|---|---|---|---|---|---|---|---|
0 |
1768237 |
18 |
4831 |
352.9 |
39.82 |
Amino acid frequency
Ala |
Cys |
Asp |
Glu |
Phe |
Gly |
His |
Ile |
Lys |
Leu |
|---|---|---|---|---|---|---|---|---|---|
6.358 ± 0.033 | 0.744 ± 0.011 |
5.759 ± 0.027 | 6.691 ± 0.032 |
5.194 ± 0.025 | 6.979 ± 0.035 |
1.942 ± 0.018 | 7.295 ± 0.029 |
7.068 ± 0.046 | 9.628 ± 0.039 |
Met |
Asn |
Gln |
Pro |
Arg |
Ser |
Thr |
Val |
Trp |
Tyr |
|---|---|---|---|---|---|---|---|---|---|
2.301 ± 0.016 | 5.549 ± 0.033 |
3.76 ± 0.022 | 3.379 ± 0.017 |
4.013 ± 0.022 | 6.341 ± 0.025 |
5.597 ± 0.038 | 6.194 ± 0.023 |
1.252 ± 0.013 | 3.957 ± 0.022 |
Most of the basic statistics you can see at this page can be downloaded from this CSV file
Proteome-pI is available under Creative Commons Attribution-NoDerivs license, for more details see here
| Reference: Kozlowski LP. Proteome-pI 2.0: Proteome Isoelectric Point Database Update. Nucleic Acids Res. 2021, doi: 10.1093/nar/gkab944 | Contact: Lukasz P. Kozlowski |
