Vicugna pacos (Alpaca) (Lama pacos)
Taxonomy: cellular organisms; Eukaryota; Opisthokonta; Metazoa; Eumetazoa; Bilateria; Deuterostomia; Chordata; Craniata; Vertebrata; Gnathostomata; Teleostomi; Euteleostomi; Sarcopterygii; Dipnotetrapodomorpha; Tetrapoda; Amniota; Mammalia; Theria; Eutheria; Boreoeutheria; Laurasiatheria;
Average proteome isoelectric point is 6.69
Get precalculated fractions of proteins

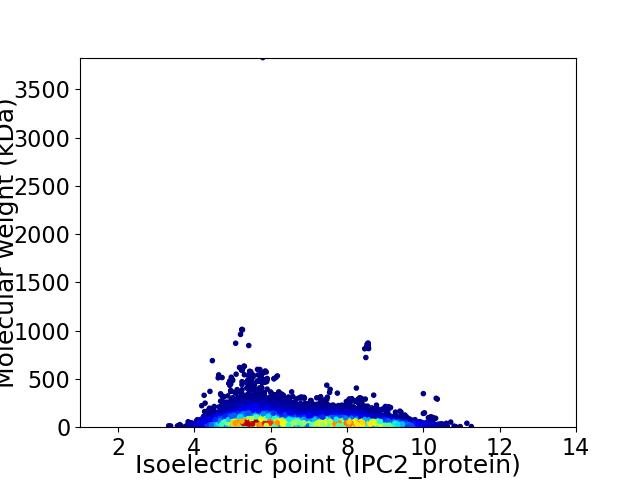
Virtual 2D-PAGE plot for 36880 proteins (isoelectric point calculated using IPC2_protein)
Get csv file with sequences according to given criteria:
* You can choose from 21 different methods for calculating isoelectric point
Summary statistics related to proteome-wise predictions


Protein with the lowest isoelectric point:
>tr|A0A6J3BDL2|A0A6J3BDL2_VICPA Isoform of A0A6J3BBS2 CTD small phosphatase-like protein isoform X5 OS=Vicugna pacos OX=30538 GN=CTDSPL PE=4 SV=1
MM1 pKa = 7.36EE2 pKa = 5.31AVSLSPYY9 pKa = 10.69VLGLLLLPLLAVLLMALCVRR29 pKa = 11.84CRR31 pKa = 11.84EE32 pKa = 4.25LPGSYY37 pKa = 8.66DD38 pKa = 3.31TAASDD43 pKa = 3.84SLTPSSIVIKK53 pKa = 10.35RR54 pKa = 11.84PPTLAPWPPATSYY67 pKa = 11.11PPVTSYY73 pKa = 11.3PPLNQPDD80 pKa = 4.81LLPIPRR86 pKa = 11.84SPQPPGGSHH95 pKa = 6.82RR96 pKa = 11.84MPSSRR101 pKa = 11.84QASDD105 pKa = 3.11GANSVASYY113 pKa = 10.76EE114 pKa = 4.13NEE116 pKa = 3.86EE117 pKa = 4.29PVCEE121 pKa = 5.65DD122 pKa = 3.23EE123 pKa = 7.0DD124 pKa = 4.15EE125 pKa = 5.92DD126 pKa = 4.66EE127 pKa = 6.11DD128 pKa = 4.81EE129 pKa = 4.41EE130 pKa = 5.69DD131 pKa = 3.77YY132 pKa = 11.56HH133 pKa = 8.4NEE135 pKa = 4.02GYY137 pKa = 10.83LVVLPDD143 pKa = 3.85SVPATGTTVPPAPVSNNPGPRR164 pKa = 11.84DD165 pKa = 3.34SAFSMEE171 pKa = 4.23SGEE174 pKa = 4.99DD175 pKa = 3.63YY176 pKa = 11.66VNVPEE181 pKa = 4.68SEE183 pKa = 4.29EE184 pKa = 4.1SADD187 pKa = 3.58ASLDD191 pKa = 3.44GSRR194 pKa = 11.84EE195 pKa = 3.99YY196 pKa = 11.72VNVSQEE202 pKa = 4.06LQPVAGTKK210 pKa = 9.68PATPGSRR217 pKa = 11.84EE218 pKa = 4.08VEE220 pKa = 4.17DD221 pKa = 4.96EE222 pKa = 4.04EE223 pKa = 6.11APDD226 pKa = 4.29YY227 pKa = 11.55EE228 pKa = 4.24NLQPNN233 pKa = 3.81
MM1 pKa = 7.36EE2 pKa = 5.31AVSLSPYY9 pKa = 10.69VLGLLLLPLLAVLLMALCVRR29 pKa = 11.84CRR31 pKa = 11.84EE32 pKa = 4.25LPGSYY37 pKa = 8.66DD38 pKa = 3.31TAASDD43 pKa = 3.84SLTPSSIVIKK53 pKa = 10.35RR54 pKa = 11.84PPTLAPWPPATSYY67 pKa = 11.11PPVTSYY73 pKa = 11.3PPLNQPDD80 pKa = 4.81LLPIPRR86 pKa = 11.84SPQPPGGSHH95 pKa = 6.82RR96 pKa = 11.84MPSSRR101 pKa = 11.84QASDD105 pKa = 3.11GANSVASYY113 pKa = 10.76EE114 pKa = 4.13NEE116 pKa = 3.86EE117 pKa = 4.29PVCEE121 pKa = 5.65DD122 pKa = 3.23EE123 pKa = 7.0DD124 pKa = 4.15EE125 pKa = 5.92DD126 pKa = 4.66EE127 pKa = 6.11DD128 pKa = 4.81EE129 pKa = 4.41EE130 pKa = 5.69DD131 pKa = 3.77YY132 pKa = 11.56HH133 pKa = 8.4NEE135 pKa = 4.02GYY137 pKa = 10.83LVVLPDD143 pKa = 3.85SVPATGTTVPPAPVSNNPGPRR164 pKa = 11.84DD165 pKa = 3.34SAFSMEE171 pKa = 4.23SGEE174 pKa = 4.99DD175 pKa = 3.63YY176 pKa = 11.66VNVPEE181 pKa = 4.68SEE183 pKa = 4.29EE184 pKa = 4.1SADD187 pKa = 3.58ASLDD191 pKa = 3.44GSRR194 pKa = 11.84EE195 pKa = 3.99YY196 pKa = 11.72VNVSQEE202 pKa = 4.06LQPVAGTKK210 pKa = 9.68PATPGSRR217 pKa = 11.84EE218 pKa = 4.08VEE220 pKa = 4.17DD221 pKa = 4.96EE222 pKa = 4.04EE223 pKa = 6.11APDD226 pKa = 4.29YY227 pKa = 11.55EE228 pKa = 4.24NLQPNN233 pKa = 3.81
Molecular weight: 24.94 kDa
Isoelectric point according different methods:
Protein with the highest isoelectric point:
>tr|A0A6J0AI98|A0A6J0AI98_VICPA forkhead box protein I3 OS=Vicugna pacos OX=30538 GN=FOXI3 PE=4 SV=1
MM1 pKa = 7.52SPLKK5 pKa = 9.95TFRR8 pKa = 11.84TRR10 pKa = 11.84RR11 pKa = 11.84FLVKK15 pKa = 9.92KK16 pKa = 9.95QKK18 pKa = 9.18QNRR21 pKa = 11.84PTPQWVHH28 pKa = 4.65MKK30 pKa = 8.71TRR32 pKa = 11.84SKK34 pKa = 10.24IRR36 pKa = 11.84HH37 pKa = 4.55NSKK40 pKa = 8.85RR41 pKa = 11.84RR42 pKa = 11.84RR43 pKa = 11.84WRR45 pKa = 11.84RR46 pKa = 11.84TKK48 pKa = 9.9WGLL51 pKa = 3.16
MM1 pKa = 7.52SPLKK5 pKa = 9.95TFRR8 pKa = 11.84TRR10 pKa = 11.84RR11 pKa = 11.84FLVKK15 pKa = 9.92KK16 pKa = 9.95QKK18 pKa = 9.18QNRR21 pKa = 11.84PTPQWVHH28 pKa = 4.65MKK30 pKa = 8.71TRR32 pKa = 11.84SKK34 pKa = 10.24IRR36 pKa = 11.84HH37 pKa = 4.55NSKK40 pKa = 8.85RR41 pKa = 11.84RR42 pKa = 11.84RR43 pKa = 11.84WRR45 pKa = 11.84RR46 pKa = 11.84TKK48 pKa = 9.9WGLL51 pKa = 3.16
Molecular weight: 6.53 kDa
Isoelectric point according different methods:
Peptides (in silico digests for buttom-up proteomics)
Below you can find in silico digests of the whole proteome with Trypsin, Chymotrypsin, Trypsin+LysC, LysN, ArgC proteases suitable for different mass spec machines.| Try ESI |
 |
|---|
| ChTry ESI |
 |
|---|
| ArgC ESI |
 |
|---|
| LysN ESI |
 |
|---|
| TryLysC ESI |
 |
|---|
| Try MALDI |
 |
|---|
| ChTry MALDI |
 |
|---|
| ArgC MALDI |
 |
|---|
| LysN MALDI |
 |
|---|
| TryLysC MALDI |
 |
|---|
| Try LTQ |
 |
|---|
| ChTry LTQ |
 |
|---|
| ArgC LTQ |
 |
|---|
| LysN LTQ |
 |
|---|
| TryLysC LTQ |
 |
|---|
| Try MSlow |
 |
|---|
| ChTry MSlow |
 |
|---|
| ArgC MSlow |
 |
|---|
| LysN MSlow |
 |
|---|
| TryLysC MSlow |
 |
|---|
| Try MShigh |
 |
|---|
| ChTry MShigh |
 |
|---|
| ArgC MShigh |
 |
|---|
| LysN MShigh |
 |
|---|
| TryLysC MShigh |
 |
|---|
General Statistics
Number of major isoforms |
Number of additional isoforms |
Number of all proteins |
Number of amino acids |
Min. Seq. Length |
Max. Seq. Length |
Avg. Seq. Length |
Avg. Mol. Weight |
|---|---|---|---|---|---|---|---|
24174655 |
31 |
34501 |
655.5 |
73.0 |
Amino acid frequency
Ala |
Cys |
Asp |
Glu |
Phe |
Gly |
His |
Ile |
Lys |
Leu |
|---|---|---|---|---|---|---|---|---|---|
6.98 ± 0.013 | 2.081 ± 0.009 |
4.898 ± 0.009 | 7.289 ± 0.018 |
3.451 ± 0.01 | 6.377 ± 0.017 |
2.574 ± 0.006 | 4.197 ± 0.011 |
5.855 ± 0.02 | 9.863 ± 0.017 |
Met |
Asn |
Gln |
Pro |
Arg |
Ser |
Thr |
Val |
Trp |
Tyr |
|---|---|---|---|---|---|---|---|---|---|
2.12 ± 0.005 | 3.539 ± 0.01 |
6.376 ± 0.022 | 4.945 ± 0.012 |
5.739 ± 0.013 | 8.579 ± 0.018 |
5.372 ± 0.011 | 6.012 ± 0.013 |
1.155 ± 0.004 | 2.566 ± 0.011 |
Most of the basic statistics you can see at this page can be downloaded from this CSV file
Proteome-pI is available under Creative Commons Attribution-NoDerivs license, for more details see here
| Reference: Kozlowski LP. Proteome-pI 2.0: Proteome Isoelectric Point Database Update. Nucleic Acids Res. 2021, doi: 10.1093/nar/gkab944 | Contact: Lukasz P. Kozlowski |
