Hartmannibacter diazotrophicus
Taxonomy: cellular organisms; Bacteria; Proteobacteria; Alphaproteobacteria; Hyphomicrobiales; Pleomorphomonadaceae; Hartmannibacter
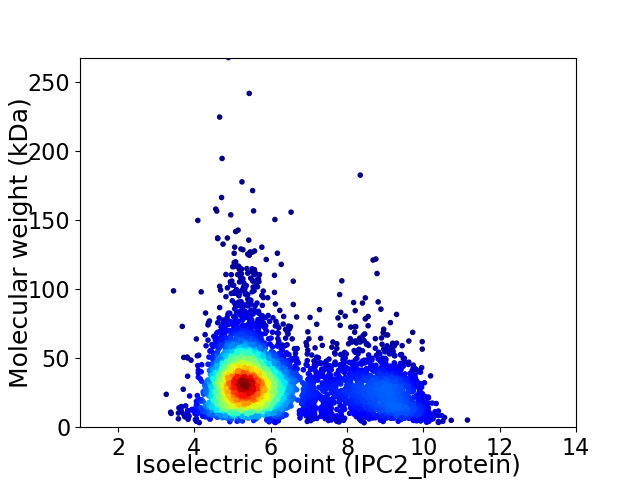
Average proteome isoelectric point is 6.22
Get precalculated fractions of proteins

Virtual 2D-PAGE plot for 4966 proteins (isoelectric point calculated using IPC2_protein)
Get csv file with sequences according to given criteria:
* You can choose from 21 different methods for calculating isoelectric point
Summary statistics related to proteome-wise predictions


Protein with the lowest isoelectric point:
>tr|A0A2C9D3S9|A0A2C9D3S9_9RHIZ Bacteriophage head-tail adaptor OS=Hartmannibacter diazotrophicus OX=1482074 GN=HDIA_1342 PE=4 SV=1
MM1 pKa = 7.43KK2 pKa = 10.27LKK4 pKa = 10.76SILLGTAALAGMTHH18 pKa = 6.81GALAADD24 pKa = 4.64AMAEE28 pKa = 4.17APVPTAVNYY37 pKa = 10.4VEE39 pKa = 5.18VCDD42 pKa = 3.93AQGAGFFVIPGKK54 pKa = 7.46EE55 pKa = 3.95TCFKK59 pKa = 10.13IDD61 pKa = 2.98GRR63 pKa = 11.84VRR65 pKa = 11.84TGFKK69 pKa = 10.19YY70 pKa = 10.88DD71 pKa = 3.56EE72 pKa = 5.69DD73 pKa = 4.22GTTNPAGGTADD84 pKa = 3.48AYY86 pKa = 9.94TWFADD91 pKa = 3.29ARR93 pKa = 11.84IGFDD97 pKa = 3.2ARR99 pKa = 11.84TASDD103 pKa = 3.69YY104 pKa = 11.49GPVRR108 pKa = 11.84SYY110 pKa = 11.24FRR112 pKa = 11.84IKK114 pKa = 10.45VSSSGNVVADD124 pKa = 3.46QAFVQVGYY132 pKa = 10.96LLTGYY137 pKa = 10.4SDD139 pKa = 4.03SDD141 pKa = 3.62VLAAAGLDD149 pKa = 3.52EE150 pKa = 4.43TGEE153 pKa = 4.11YY154 pKa = 11.18GNFRR158 pKa = 11.84DD159 pKa = 3.98VTFGLPTDD167 pKa = 4.6DD168 pKa = 5.19NGGLQFDD175 pKa = 5.25LLADD179 pKa = 4.04DD180 pKa = 4.86LGGGFFAGVQVIDD193 pKa = 4.08GGAAGTFSQQYY204 pKa = 9.09NKK206 pKa = 9.29TAEE209 pKa = 4.11SVAFGGVVGITGQPWGAASLFAMYY233 pKa = 10.25DD234 pKa = 3.56DD235 pKa = 5.38EE236 pKa = 7.31DD237 pKa = 4.36DD238 pKa = 3.96QVSVRR243 pKa = 11.84ATGNFNVMEE252 pKa = 4.61GLQIAAVIGYY262 pKa = 6.94MTNNDD267 pKa = 3.41GNVGYY272 pKa = 8.44MAQGNVDD279 pKa = 3.86TVALGLGASYY289 pKa = 11.35DD290 pKa = 3.57VTSDD294 pKa = 3.41VNVYY298 pKa = 10.64LSGIYY303 pKa = 10.3GFNDD307 pKa = 2.82NSTSDD312 pKa = 3.45SYY314 pKa = 11.89DD315 pKa = 3.29ILGGAAWTFAEE326 pKa = 4.84GTSLVGEE333 pKa = 4.36VSYY336 pKa = 11.16TDD338 pKa = 3.37NPGVSGAVGATVGLIRR354 pKa = 11.84KK355 pKa = 6.94WW356 pKa = 3.18
MM1 pKa = 7.43KK2 pKa = 10.27LKK4 pKa = 10.76SILLGTAALAGMTHH18 pKa = 6.81GALAADD24 pKa = 4.64AMAEE28 pKa = 4.17APVPTAVNYY37 pKa = 10.4VEE39 pKa = 5.18VCDD42 pKa = 3.93AQGAGFFVIPGKK54 pKa = 7.46EE55 pKa = 3.95TCFKK59 pKa = 10.13IDD61 pKa = 2.98GRR63 pKa = 11.84VRR65 pKa = 11.84TGFKK69 pKa = 10.19YY70 pKa = 10.88DD71 pKa = 3.56EE72 pKa = 5.69DD73 pKa = 4.22GTTNPAGGTADD84 pKa = 3.48AYY86 pKa = 9.94TWFADD91 pKa = 3.29ARR93 pKa = 11.84IGFDD97 pKa = 3.2ARR99 pKa = 11.84TASDD103 pKa = 3.69YY104 pKa = 11.49GPVRR108 pKa = 11.84SYY110 pKa = 11.24FRR112 pKa = 11.84IKK114 pKa = 10.45VSSSGNVVADD124 pKa = 3.46QAFVQVGYY132 pKa = 10.96LLTGYY137 pKa = 10.4SDD139 pKa = 4.03SDD141 pKa = 3.62VLAAAGLDD149 pKa = 3.52EE150 pKa = 4.43TGEE153 pKa = 4.11YY154 pKa = 11.18GNFRR158 pKa = 11.84DD159 pKa = 3.98VTFGLPTDD167 pKa = 4.6DD168 pKa = 5.19NGGLQFDD175 pKa = 5.25LLADD179 pKa = 4.04DD180 pKa = 4.86LGGGFFAGVQVIDD193 pKa = 4.08GGAAGTFSQQYY204 pKa = 9.09NKK206 pKa = 9.29TAEE209 pKa = 4.11SVAFGGVVGITGQPWGAASLFAMYY233 pKa = 10.25DD234 pKa = 3.56DD235 pKa = 5.38EE236 pKa = 7.31DD237 pKa = 4.36DD238 pKa = 3.96QVSVRR243 pKa = 11.84ATGNFNVMEE252 pKa = 4.61GLQIAAVIGYY262 pKa = 6.94MTNNDD267 pKa = 3.41GNVGYY272 pKa = 8.44MAQGNVDD279 pKa = 3.86TVALGLGASYY289 pKa = 11.35DD290 pKa = 3.57VTSDD294 pKa = 3.41VNVYY298 pKa = 10.64LSGIYY303 pKa = 10.3GFNDD307 pKa = 2.82NSTSDD312 pKa = 3.45SYY314 pKa = 11.89DD315 pKa = 3.29ILGGAAWTFAEE326 pKa = 4.84GTSLVGEE333 pKa = 4.36VSYY336 pKa = 11.16TDD338 pKa = 3.37NPGVSGAVGATVGLIRR354 pKa = 11.84KK355 pKa = 6.94WW356 pKa = 3.18
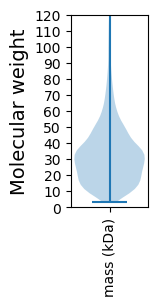
Molecular weight: 36.91 kDa
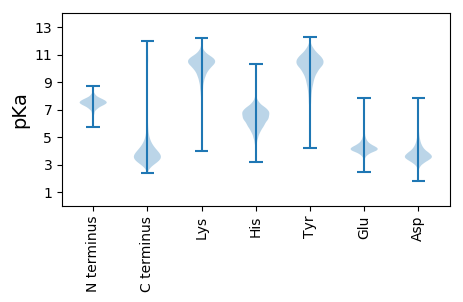
Isoelectric point according different methods:
Protein with the highest isoelectric point:
>tr|A0A2C9D1C2|A0A2C9D1C2_9RHIZ Acetoacetyl CoA synthase NphT7 OS=Hartmannibacter diazotrophicus OX=1482074 GN=nphT7 PE=4 SV=1
MM1 pKa = 7.35KK2 pKa = 9.43RR3 pKa = 11.84TYY5 pKa = 10.27QPSKK9 pKa = 9.73LVRR12 pKa = 11.84KK13 pKa = 8.95RR14 pKa = 11.84RR15 pKa = 11.84HH16 pKa = 4.63GFRR19 pKa = 11.84SRR21 pKa = 11.84MATVGGRR28 pKa = 11.84KK29 pKa = 9.31VIAARR34 pKa = 11.84RR35 pKa = 11.84ARR37 pKa = 11.84GRR39 pKa = 11.84KK40 pKa = 9.03RR41 pKa = 11.84LSAA44 pKa = 4.03
MM1 pKa = 7.35KK2 pKa = 9.43RR3 pKa = 11.84TYY5 pKa = 10.27QPSKK9 pKa = 9.73LVRR12 pKa = 11.84KK13 pKa = 8.95RR14 pKa = 11.84RR15 pKa = 11.84HH16 pKa = 4.63GFRR19 pKa = 11.84SRR21 pKa = 11.84MATVGGRR28 pKa = 11.84KK29 pKa = 9.31VIAARR34 pKa = 11.84RR35 pKa = 11.84ARR37 pKa = 11.84GRR39 pKa = 11.84KK40 pKa = 9.03RR41 pKa = 11.84LSAA44 pKa = 4.03
Molecular weight: 5.15 kDa
Isoelectric point according different methods:
Peptides (in silico digests for buttom-up proteomics)
Below you can find in silico digests of the whole proteome with Trypsin, Chymotrypsin, Trypsin+LysC, LysN, ArgC proteases suitable for different mass spec machines.| Try ESI |
 |
|---|
| ChTry ESI |
 |
|---|
| ArgC ESI |
 |
|---|
| LysN ESI |
 |
|---|
| TryLysC ESI |
 |
|---|
| Try MALDI |
 |
|---|
| ChTry MALDI |
 |
|---|
| ArgC MALDI |
 |
|---|
| LysN MALDI |
 |
|---|
| TryLysC MALDI |
 |
|---|
| Try LTQ |
 |
|---|
| ChTry LTQ |
 |
|---|
| ArgC LTQ |
 |
|---|
| LysN LTQ |
 |
|---|
| TryLysC LTQ |
 |
|---|
| Try MSlow |
 |
|---|
| ChTry MSlow |
 |
|---|
| ArgC MSlow |
 |
|---|
| LysN MSlow |
 |
|---|
| TryLysC MSlow |
 |
|---|
| Try MShigh |
 |
|---|
| ChTry MShigh |
 |
|---|
| ArgC MShigh |
 |
|---|
| LysN MShigh |
 |
|---|
| TryLysC MShigh |
 |
|---|
General Statistics
Number of major isoforms |
Number of additional isoforms |
Number of all proteins |
Number of amino acids |
Min. Seq. Length |
Max. Seq. Length |
Avg. Seq. Length |
Avg. Mol. Weight |
|---|---|---|---|---|---|---|---|
0 |
1563237 |
29 |
2507 |
314.8 |
34.09 |
Amino acid frequency
Ala |
Cys |
Asp |
Glu |
Phe |
Gly |
His |
Ile |
Lys |
Leu |
|---|---|---|---|---|---|---|---|---|---|
12.354 ± 0.043 | 0.847 ± 0.012 |
5.963 ± 0.03 | 5.835 ± 0.032 |
3.812 ± 0.021 | 8.604 ± 0.029 |
2.012 ± 0.018 | 5.364 ± 0.023 |
3.326 ± 0.027 | 10.098 ± 0.041 |
Met |
Asn |
Gln |
Pro |
Arg |
Ser |
Thr |
Val |
Trp |
Tyr |
|---|---|---|---|---|---|---|---|---|---|
2.589 ± 0.017 | 2.494 ± 0.017 |
5.122 ± 0.025 | 2.801 ± 0.018 |
6.846 ± 0.033 | 5.58 ± 0.029 |
5.366 ± 0.024 | 7.594 ± 0.028 |
1.246 ± 0.012 | 2.148 ± 0.017 |
Most of the basic statistics you can see at this page can be downloaded from this CSV file
Proteome-pI is available under Creative Commons Attribution-NoDerivs license, for more details see here
| Reference: Kozlowski LP. Proteome-pI 2.0: Proteome Isoelectric Point Database Update. Nucleic Acids Res. 2021, doi: 10.1093/nar/gkab944 | Contact: Lukasz P. Kozlowski |
