Actinoplanes sp. ATCC 53533
Taxonomy: cellular organisms; Bacteria; Terrabacteria group; Actinobacteria; Actinomycetia; Micromonosporales; Micromonosporaceae; Actinoplanes; unclassified Actinoplanes
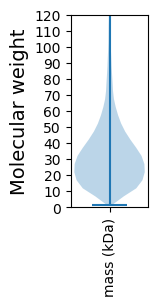
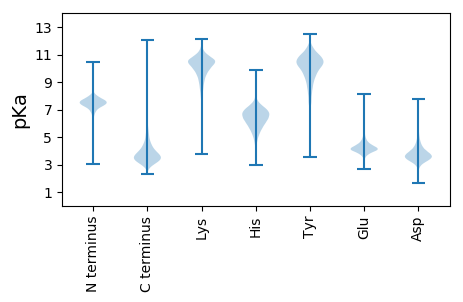
Average proteome isoelectric point is 6.6
Get precalculated fractions of proteins

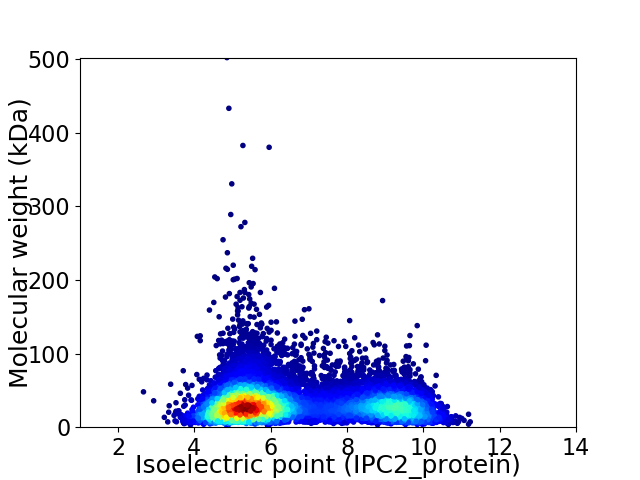
Virtual 2D-PAGE plot for 11557 proteins (isoelectric point calculated using IPC2_protein)
Get csv file with sequences according to given criteria:
* You can choose from 21 different methods for calculating isoelectric point
Summary statistics related to proteome-wise predictions


Protein with the lowest isoelectric point:
>tr|A0A428YRF3|A0A428YRF3_9ACTN ArsR family transcriptional regulator OS=Actinoplanes sp. ATCC 53533 OX=1288362 GN=DMB66_07285 PE=4 SV=1
MM1 pKa = 7.58SDD3 pKa = 2.83EE4 pKa = 5.08HH5 pKa = 6.41GWPDD9 pKa = 4.02FSDD12 pKa = 3.85PDD14 pKa = 4.0GPEE17 pKa = 3.77DD18 pKa = 3.48HH19 pKa = 7.37HH20 pKa = 8.04DD21 pKa = 3.79HH22 pKa = 6.9GGHH25 pKa = 6.59GDD27 pKa = 3.58QFGTPAAEE35 pKa = 4.32ADD37 pKa = 4.08SPFHH41 pKa = 7.46DD42 pKa = 5.13DD43 pKa = 5.09VFGHH47 pKa = 7.68DD48 pKa = 4.64DD49 pKa = 3.57DD50 pKa = 4.42QAQGFAGHH58 pKa = 7.27DD59 pKa = 3.7LDD61 pKa = 5.97GGPDD65 pKa = 3.63LDD67 pKa = 6.17GIDD70 pKa = 4.22GGHH73 pKa = 6.7GLDD76 pKa = 4.24EE77 pKa = 4.62SQDD80 pKa = 3.38AAGWDD85 pKa = 3.56DD86 pKa = 4.19HH87 pKa = 7.1EE88 pKa = 5.91PGTGHH93 pKa = 7.89DD94 pKa = 4.19DD95 pKa = 3.47AADD98 pKa = 3.79AGVVDD103 pKa = 4.31VTDD106 pKa = 3.81GHH108 pKa = 5.8TMGPVGADD116 pKa = 3.17PDD118 pKa = 3.73AATDD122 pKa = 4.09FEE124 pKa = 4.7QVSLFPPAVDD134 pKa = 3.25VGPLPEE140 pKa = 4.99PVDD143 pKa = 3.67GFPWIDD149 pKa = 3.27TGSLGLYY156 pKa = 10.4HH157 pKa = 7.15SGLDD161 pKa = 3.43HH162 pKa = 7.5AALAEE167 pKa = 4.18PAAEE171 pKa = 3.83PVAAQDD177 pKa = 3.64LAAYY181 pKa = 9.35AAEE184 pKa = 4.49DD185 pKa = 4.25LPPGVDD191 pKa = 3.2PWAALADD198 pKa = 3.91SDD200 pKa = 5.74DD201 pKa = 4.3PATSALAKK209 pKa = 8.62WWHH212 pKa = 6.48PEE214 pKa = 3.62SS215 pKa = 3.85
MM1 pKa = 7.58SDD3 pKa = 2.83EE4 pKa = 5.08HH5 pKa = 6.41GWPDD9 pKa = 4.02FSDD12 pKa = 3.85PDD14 pKa = 4.0GPEE17 pKa = 3.77DD18 pKa = 3.48HH19 pKa = 7.37HH20 pKa = 8.04DD21 pKa = 3.79HH22 pKa = 6.9GGHH25 pKa = 6.59GDD27 pKa = 3.58QFGTPAAEE35 pKa = 4.32ADD37 pKa = 4.08SPFHH41 pKa = 7.46DD42 pKa = 5.13DD43 pKa = 5.09VFGHH47 pKa = 7.68DD48 pKa = 4.64DD49 pKa = 3.57DD50 pKa = 4.42QAQGFAGHH58 pKa = 7.27DD59 pKa = 3.7LDD61 pKa = 5.97GGPDD65 pKa = 3.63LDD67 pKa = 6.17GIDD70 pKa = 4.22GGHH73 pKa = 6.7GLDD76 pKa = 4.24EE77 pKa = 4.62SQDD80 pKa = 3.38AAGWDD85 pKa = 3.56DD86 pKa = 4.19HH87 pKa = 7.1EE88 pKa = 5.91PGTGHH93 pKa = 7.89DD94 pKa = 4.19DD95 pKa = 3.47AADD98 pKa = 3.79AGVVDD103 pKa = 4.31VTDD106 pKa = 3.81GHH108 pKa = 5.8TMGPVGADD116 pKa = 3.17PDD118 pKa = 3.73AATDD122 pKa = 4.09FEE124 pKa = 4.7QVSLFPPAVDD134 pKa = 3.25VGPLPEE140 pKa = 4.99PVDD143 pKa = 3.67GFPWIDD149 pKa = 3.27TGSLGLYY156 pKa = 10.4HH157 pKa = 7.15SGLDD161 pKa = 3.43HH162 pKa = 7.5AALAEE167 pKa = 4.18PAAEE171 pKa = 3.83PVAAQDD177 pKa = 3.64LAAYY181 pKa = 9.35AAEE184 pKa = 4.49DD185 pKa = 4.25LPPGVDD191 pKa = 3.2PWAALADD198 pKa = 3.91SDD200 pKa = 5.74DD201 pKa = 4.3PATSALAKK209 pKa = 8.62WWHH212 pKa = 6.48PEE214 pKa = 3.62SS215 pKa = 3.85
Molecular weight: 22.18 kDa
Isoelectric point according different methods:
Protein with the highest isoelectric point:
>tr|A0A428YW62|A0A428YW62_9ACTN GGDEF-domain containing protein OS=Actinoplanes sp. ATCC 53533 OX=1288362 GN=DMB66_01575 PE=4 SV=1
MM1 pKa = 7.65AAPARR6 pKa = 11.84TSPRR10 pKa = 11.84RR11 pKa = 11.84ARR13 pKa = 11.84PPWPTPPARR22 pKa = 11.84RR23 pKa = 11.84PATRR27 pKa = 11.84RR28 pKa = 11.84SRR30 pKa = 11.84RR31 pKa = 11.84RR32 pKa = 11.84PPRR35 pKa = 11.84LRR37 pKa = 11.84RR38 pKa = 11.84PRR40 pKa = 11.84RR41 pKa = 11.84RR42 pKa = 11.84PPRR45 pKa = 11.84RR46 pKa = 11.84SQRR49 pKa = 11.84AARR52 pKa = 11.84SPPTPCWRR60 pKa = 11.84SS61 pKa = 2.96
MM1 pKa = 7.65AAPARR6 pKa = 11.84TSPRR10 pKa = 11.84RR11 pKa = 11.84ARR13 pKa = 11.84PPWPTPPARR22 pKa = 11.84RR23 pKa = 11.84PATRR27 pKa = 11.84RR28 pKa = 11.84SRR30 pKa = 11.84RR31 pKa = 11.84RR32 pKa = 11.84PPRR35 pKa = 11.84LRR37 pKa = 11.84RR38 pKa = 11.84PRR40 pKa = 11.84RR41 pKa = 11.84RR42 pKa = 11.84PPRR45 pKa = 11.84RR46 pKa = 11.84SQRR49 pKa = 11.84AARR52 pKa = 11.84SPPTPCWRR60 pKa = 11.84SS61 pKa = 2.96
Molecular weight: 7.26 kDa
Isoelectric point according different methods:
Peptides (in silico digests for buttom-up proteomics)
Below you can find in silico digests of the whole proteome with Trypsin, Chymotrypsin, Trypsin+LysC, LysN, ArgC proteases suitable for different mass spec machines.| Try ESI |
 |
|---|
| ChTry ESI |
 |
|---|
| ArgC ESI |
 |
|---|
| LysN ESI |
 |
|---|
| TryLysC ESI |
 |
|---|
| Try MALDI |
 |
|---|
| ChTry MALDI |
 |
|---|
| ArgC MALDI |
 |
|---|
| LysN MALDI |
 |
|---|
| TryLysC MALDI |
 |
|---|
| Try LTQ |
 |
|---|
| ChTry LTQ |
 |
|---|
| ArgC LTQ |
 |
|---|
| LysN LTQ |
 |
|---|
| TryLysC LTQ |
 |
|---|
| Try MSlow |
 |
|---|
| ChTry MSlow |
 |
|---|
| ArgC MSlow |
 |
|---|
| LysN MSlow |
 |
|---|
| TryLysC MSlow |
 |
|---|
| Try MShigh |
 |
|---|
| ChTry MShigh |
 |
|---|
| ArgC MShigh |
 |
|---|
| LysN MShigh |
 |
|---|
| TryLysC MShigh |
 |
|---|
General Statistics
Number of major isoforms |
Number of additional isoforms |
Number of all proteins |
Number of amino acids |
Min. Seq. Length |
Max. Seq. Length |
Avg. Seq. Length |
Avg. Mol. Weight |
|---|---|---|---|---|---|---|---|
0 |
3748102 |
15 |
4779 |
324.3 |
34.65 |
Amino acid frequency
Ala |
Cys |
Asp |
Glu |
Phe |
Gly |
His |
Ile |
Lys |
Leu |
|---|---|---|---|---|---|---|---|---|---|
14.149 ± 0.037 | 0.76 ± 0.007 |
6.002 ± 0.018 | 4.85 ± 0.021 |
2.752 ± 0.014 | 9.265 ± 0.023 |
2.152 ± 0.01 | 3.597 ± 0.013 |
1.827 ± 0.015 | 10.353 ± 0.027 |
Met |
Asn |
Gln |
Pro |
Arg |
Ser |
Thr |
Val |
Trp |
Tyr |
|---|---|---|---|---|---|---|---|---|---|
1.678 ± 0.009 | 1.938 ± 0.013 |
6.01 ± 0.02 | 2.858 ± 0.013 |
8.142 ± 0.028 | 5.03 ± 0.017 |
6.319 ± 0.026 | 8.599 ± 0.02 |
1.6 ± 0.01 | 2.117 ± 0.012 |
Most of the basic statistics you can see at this page can be downloaded from this CSV file
Proteome-pI is available under Creative Commons Attribution-NoDerivs license, for more details see here
| Reference: Kozlowski LP. Proteome-pI 2.0: Proteome Isoelectric Point Database Update. Nucleic Acids Res. 2021, doi: 10.1093/nar/gkab944 | Contact: Lukasz P. Kozlowski |
