Anaerocolumna xylanovorans DSM 12503
Taxonomy: cellular organisms; Bacteria; Terrabacteria group; Firmicutes; Clostridia; Eubacteriales; Lachnospiraceae; Anaerocolumna; Anaerocolumna xylanovorans
Average proteome isoelectric point is 6.17
Get precalculated fractions of proteins

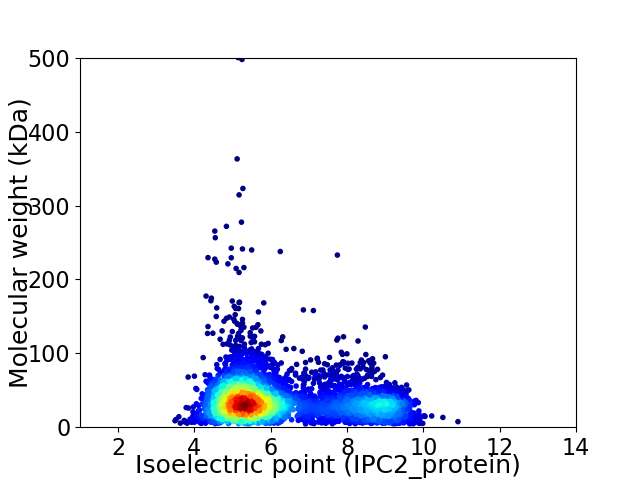
Virtual 2D-PAGE plot for 4651 proteins (isoelectric point calculated using IPC2_protein)
Get csv file with sequences according to given criteria:
* You can choose from 21 different methods for calculating isoelectric point
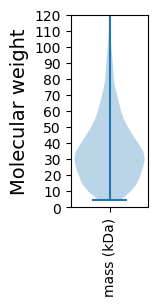
Summary statistics related to proteome-wise predictions


Protein with the lowest isoelectric point:
>tr|A0A1M7YFW8|A0A1M7YFW8_9FIRM Raffinose/stachyose/melibiose transport system permease protein OS=Anaerocolumna xylanovorans DSM 12503 OX=1121345 GN=SAMN02745217_03224 PE=3 SV=1
MM1 pKa = 7.21KK2 pKa = 9.93RR3 pKa = 11.84VKK5 pKa = 10.55IMMTLLIPALLFSACNGADD24 pKa = 3.42RR25 pKa = 11.84SSTASDD31 pKa = 3.76PSALQSMLTEE41 pKa = 4.26QIPDD45 pKa = 3.68DD46 pKa = 3.91FGFTYY51 pKa = 9.76IHH53 pKa = 6.53NFIEE57 pKa = 4.1VDD59 pKa = 3.68TFNSTIKK66 pKa = 8.43NTYY69 pKa = 8.69YY70 pKa = 10.62FSEE73 pKa = 4.76GDD75 pKa = 3.4PDD77 pKa = 5.46AITDD81 pKa = 3.77FSFSHH86 pKa = 5.9EE87 pKa = 4.09QLEE90 pKa = 4.54KK91 pKa = 10.07IYY93 pKa = 10.57EE94 pKa = 3.92AFIQYY99 pKa = 10.0DD100 pKa = 3.49IQDD103 pKa = 4.26LPEE106 pKa = 5.14EE107 pKa = 4.42IDD109 pKa = 3.45PDD111 pKa = 3.83KK112 pKa = 11.46GFMSIPPSYY121 pKa = 11.2YY122 pKa = 8.94EE123 pKa = 4.5LLYY126 pKa = 10.69ISDD129 pKa = 4.62GEE131 pKa = 4.54TKK133 pKa = 10.58NISCRR138 pKa = 11.84TGADD142 pKa = 2.91IDD144 pKa = 3.81QEE146 pKa = 4.85GISEE150 pKa = 4.31DD151 pKa = 3.33NNNFVKK157 pKa = 10.65FMAEE161 pKa = 3.33VWNYY165 pKa = 10.23VYY167 pKa = 10.74EE168 pKa = 4.47SDD170 pKa = 4.21AYY172 pKa = 10.6QRR174 pKa = 11.84LPSGPEE180 pKa = 3.58TEE182 pKa = 4.21
MM1 pKa = 7.21KK2 pKa = 9.93RR3 pKa = 11.84VKK5 pKa = 10.55IMMTLLIPALLFSACNGADD24 pKa = 3.42RR25 pKa = 11.84SSTASDD31 pKa = 3.76PSALQSMLTEE41 pKa = 4.26QIPDD45 pKa = 3.68DD46 pKa = 3.91FGFTYY51 pKa = 9.76IHH53 pKa = 6.53NFIEE57 pKa = 4.1VDD59 pKa = 3.68TFNSTIKK66 pKa = 8.43NTYY69 pKa = 8.69YY70 pKa = 10.62FSEE73 pKa = 4.76GDD75 pKa = 3.4PDD77 pKa = 5.46AITDD81 pKa = 3.77FSFSHH86 pKa = 5.9EE87 pKa = 4.09QLEE90 pKa = 4.54KK91 pKa = 10.07IYY93 pKa = 10.57EE94 pKa = 3.92AFIQYY99 pKa = 10.0DD100 pKa = 3.49IQDD103 pKa = 4.26LPEE106 pKa = 5.14EE107 pKa = 4.42IDD109 pKa = 3.45PDD111 pKa = 3.83KK112 pKa = 11.46GFMSIPPSYY121 pKa = 11.2YY122 pKa = 8.94EE123 pKa = 4.5LLYY126 pKa = 10.69ISDD129 pKa = 4.62GEE131 pKa = 4.54TKK133 pKa = 10.58NISCRR138 pKa = 11.84TGADD142 pKa = 2.91IDD144 pKa = 3.81QEE146 pKa = 4.85GISEE150 pKa = 4.31DD151 pKa = 3.33NNNFVKK157 pKa = 10.65FMAEE161 pKa = 3.33VWNYY165 pKa = 10.23VYY167 pKa = 10.74EE168 pKa = 4.47SDD170 pKa = 4.21AYY172 pKa = 10.6QRR174 pKa = 11.84LPSGPEE180 pKa = 3.58TEE182 pKa = 4.21
Molecular weight: 20.78 kDa
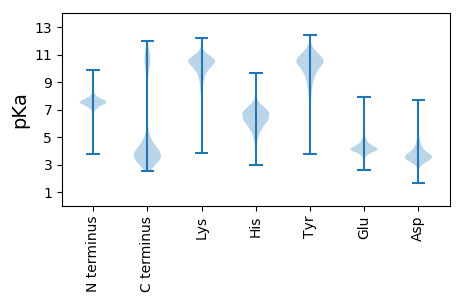
Isoelectric point according different methods:
Protein with the highest isoelectric point:
>tr|A0A1M7Y9E8|A0A1M7Y9E8_9FIRM Tetratricopeptide repeat-containing protein OS=Anaerocolumna xylanovorans DSM 12503 OX=1121345 GN=SAMN02745217_02224 PE=4 SV=1
MM1 pKa = 8.0AYY3 pKa = 10.48NKK5 pKa = 9.96NDD7 pKa = 3.6RR8 pKa = 11.84NSNRR12 pKa = 11.84DD13 pKa = 3.52DD14 pKa = 4.36KK15 pKa = 11.57GDD17 pKa = 3.42SPMRR21 pKa = 11.84RR22 pKa = 11.84RR23 pKa = 11.84NTRR26 pKa = 11.84RR27 pKa = 11.84RR28 pKa = 11.84KK29 pKa = 9.39KK30 pKa = 10.24VCAFCADD37 pKa = 3.9KK38 pKa = 11.2NHH40 pKa = 6.6TGIDD44 pKa = 3.6YY45 pKa = 11.12KK46 pKa = 11.13DD47 pKa = 3.47VNKK50 pKa = 10.54LKK52 pKa = 10.45RR53 pKa = 11.84YY54 pKa = 7.87VSEE57 pKa = 4.16RR58 pKa = 11.84GKK60 pKa = 10.18ILPRR64 pKa = 11.84RR65 pKa = 11.84ITGNCAKK72 pKa = 9.81HH73 pKa = 5.44QRR75 pKa = 11.84ALTVAIKK82 pKa = 10.11RR83 pKa = 11.84ARR85 pKa = 11.84HH86 pKa = 5.13IALMPYY92 pKa = 9.53TLDD95 pKa = 3.28
MM1 pKa = 8.0AYY3 pKa = 10.48NKK5 pKa = 9.96NDD7 pKa = 3.6RR8 pKa = 11.84NSNRR12 pKa = 11.84DD13 pKa = 3.52DD14 pKa = 4.36KK15 pKa = 11.57GDD17 pKa = 3.42SPMRR21 pKa = 11.84RR22 pKa = 11.84RR23 pKa = 11.84NTRR26 pKa = 11.84RR27 pKa = 11.84RR28 pKa = 11.84KK29 pKa = 9.39KK30 pKa = 10.24VCAFCADD37 pKa = 3.9KK38 pKa = 11.2NHH40 pKa = 6.6TGIDD44 pKa = 3.6YY45 pKa = 11.12KK46 pKa = 11.13DD47 pKa = 3.47VNKK50 pKa = 10.54LKK52 pKa = 10.45RR53 pKa = 11.84YY54 pKa = 7.87VSEE57 pKa = 4.16RR58 pKa = 11.84GKK60 pKa = 10.18ILPRR64 pKa = 11.84RR65 pKa = 11.84ITGNCAKK72 pKa = 9.81HH73 pKa = 5.44QRR75 pKa = 11.84ALTVAIKK82 pKa = 10.11RR83 pKa = 11.84ARR85 pKa = 11.84HH86 pKa = 5.13IALMPYY92 pKa = 9.53TLDD95 pKa = 3.28
Molecular weight: 11.16 kDa
Isoelectric point according different methods:
Peptides (in silico digests for buttom-up proteomics)
Below you can find in silico digests of the whole proteome with Trypsin, Chymotrypsin, Trypsin+LysC, LysN, ArgC proteases suitable for different mass spec machines.| Try ESI |
 |
|---|
| ChTry ESI |
 |
|---|
| ArgC ESI |
 |
|---|
| LysN ESI |
 |
|---|
| TryLysC ESI |
 |
|---|
| Try MALDI |
 |
|---|
| ChTry MALDI |
 |
|---|
| ArgC MALDI |
 |
|---|
| LysN MALDI |
 |
|---|
| TryLysC MALDI |
 |
|---|
| Try LTQ |
 |
|---|
| ChTry LTQ |
 |
|---|
| ArgC LTQ |
 |
|---|
| LysN LTQ |
 |
|---|
| TryLysC LTQ |
 |
|---|
| Try MSlow |
 |
|---|
| ChTry MSlow |
 |
|---|
| ArgC MSlow |
 |
|---|
| LysN MSlow |
 |
|---|
| TryLysC MSlow |
 |
|---|
| Try MShigh |
 |
|---|
| ChTry MShigh |
 |
|---|
| ArgC MShigh |
 |
|---|
| LysN MShigh |
 |
|---|
| TryLysC MShigh |
 |
|---|
General Statistics
Number of major isoforms |
Number of additional isoforms |
Number of all proteins |
Number of amino acids |
Min. Seq. Length |
Max. Seq. Length |
Avg. Seq. Length |
Avg. Mol. Weight |
|---|---|---|---|---|---|---|---|
0 |
1598021 |
39 |
4409 |
343.6 |
38.62 |
Amino acid frequency
Ala |
Cys |
Asp |
Glu |
Phe |
Gly |
His |
Ile |
Lys |
Leu |
|---|---|---|---|---|---|---|---|---|---|
6.913 ± 0.037 | 1.268 ± 0.014 |
5.429 ± 0.024 | 7.363 ± 0.044 |
4.244 ± 0.029 | 6.894 ± 0.033 |
1.564 ± 0.014 | 8.133 ± 0.032 |
7.532 ± 0.034 | 9.312 ± 0.035 |
Met |
Asn |
Gln |
Pro |
Arg |
Ser |
Thr |
Val |
Trp |
Tyr |
|---|---|---|---|---|---|---|---|---|---|
2.767 ± 0.016 | 4.981 ± 0.026 |
3.152 ± 0.02 | 2.924 ± 0.018 |
3.875 ± 0.027 | 6.289 ± 0.032 |
5.608 ± 0.04 | 6.339 ± 0.028 |
0.93 ± 0.013 | 4.482 ± 0.025 |
Most of the basic statistics you can see at this page can be downloaded from this CSV file
Proteome-pI is available under Creative Commons Attribution-NoDerivs license, for more details see here
| Reference: Kozlowski LP. Proteome-pI 2.0: Proteome Isoelectric Point Database Update. Nucleic Acids Res. 2021, doi: 10.1093/nar/gkab944 | Contact: Lukasz P. Kozlowski |
