Brevundimonas sp. MYb31
Taxonomy: cellular organisms; Bacteria; Proteobacteria; Alphaproteobacteria; Caulobacterales; Caulobacteraceae; Brevundimonas; unclassified Brevundimonas
Average proteome isoelectric point is 6.33
Get precalculated fractions of proteins

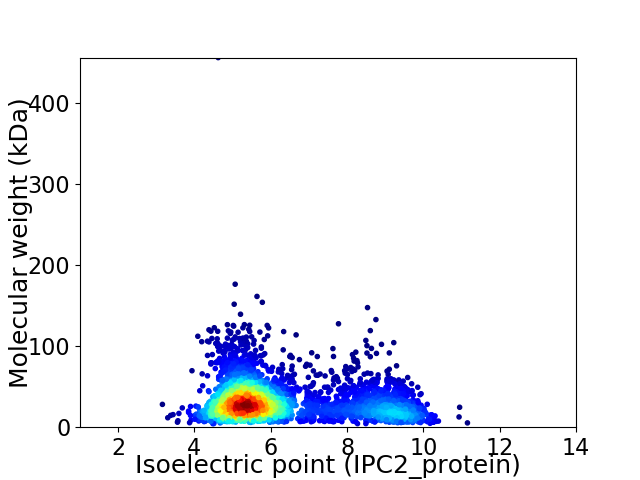
Virtual 2D-PAGE plot for 3210 proteins (isoelectric point calculated using IPC2_protein)
Get csv file with sequences according to given criteria:
* You can choose from 21 different methods for calculating isoelectric point
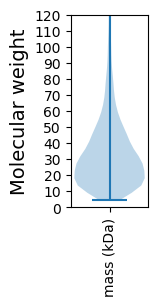
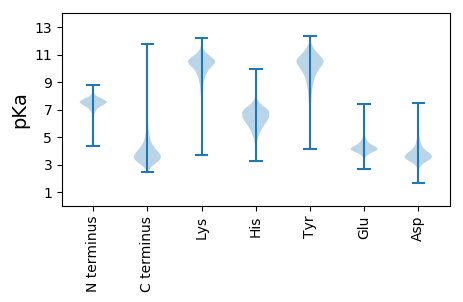
Summary statistics related to proteome-wise predictions


Protein with the lowest isoelectric point:
>tr|A0A2S8WAN0|A0A2S8WAN0_9CAUL Polysaccharide biosynthesis protein OS=Brevundimonas sp. MYb31 OX=1848616 GN=CQ026_02385 PE=4 SV=1
MM1 pKa = 7.71RR2 pKa = 11.84LALACASLLALTVGAGAAQAQSAPEE27 pKa = 3.73VAFNIGVVSDD37 pKa = 3.66YY38 pKa = 11.09VFRR41 pKa = 11.84GASQTDD47 pKa = 3.8EE48 pKa = 5.11DD49 pKa = 4.68PALQGGIDD57 pKa = 3.4ATFGGFYY64 pKa = 10.32AGTWASMVDD73 pKa = 4.5FGDD76 pKa = 3.97DD77 pKa = 2.89TDD79 pKa = 5.71AEE81 pKa = 4.16VDD83 pKa = 3.69LYY85 pKa = 11.39GGYY88 pKa = 8.19RR89 pKa = 11.84TEE91 pKa = 4.05AAGYY95 pKa = 9.41ALDD98 pKa = 4.2FGVVGYY104 pKa = 8.54FYY106 pKa = 11.39VNEE109 pKa = 4.23PSAADD114 pKa = 3.39YY115 pKa = 9.78TYY117 pKa = 11.59VEE119 pKa = 5.28FKK121 pKa = 10.69AAASRR126 pKa = 11.84AIGPATVGAAVYY138 pKa = 8.32YY139 pKa = 10.71SPDD142 pKa = 3.13FFGVDD147 pKa = 3.67DD148 pKa = 3.89EE149 pKa = 4.53ATYY152 pKa = 11.32LEE154 pKa = 4.76ANAAYY159 pKa = 10.38ALADD163 pKa = 3.08KK164 pKa = 8.41WTVSGAVGHH173 pKa = 5.67QWLNVTDD180 pKa = 6.25DD181 pKa = 3.68YY182 pKa = 10.0TTWNVGLAYY191 pKa = 10.53ALTDD195 pKa = 3.5NLAVDD200 pKa = 4.03VRR202 pKa = 11.84YY203 pKa = 10.12HH204 pKa = 6.19DD205 pKa = 3.93TDD207 pKa = 3.03VDD209 pKa = 4.47GPLTDD214 pKa = 3.9DD215 pKa = 3.8RR216 pKa = 11.84FVVGLKK222 pKa = 10.64ASFF225 pKa = 3.45
MM1 pKa = 7.71RR2 pKa = 11.84LALACASLLALTVGAGAAQAQSAPEE27 pKa = 3.73VAFNIGVVSDD37 pKa = 3.66YY38 pKa = 11.09VFRR41 pKa = 11.84GASQTDD47 pKa = 3.8EE48 pKa = 5.11DD49 pKa = 4.68PALQGGIDD57 pKa = 3.4ATFGGFYY64 pKa = 10.32AGTWASMVDD73 pKa = 4.5FGDD76 pKa = 3.97DD77 pKa = 2.89TDD79 pKa = 5.71AEE81 pKa = 4.16VDD83 pKa = 3.69LYY85 pKa = 11.39GGYY88 pKa = 8.19RR89 pKa = 11.84TEE91 pKa = 4.05AAGYY95 pKa = 9.41ALDD98 pKa = 4.2FGVVGYY104 pKa = 8.54FYY106 pKa = 11.39VNEE109 pKa = 4.23PSAADD114 pKa = 3.39YY115 pKa = 9.78TYY117 pKa = 11.59VEE119 pKa = 5.28FKK121 pKa = 10.69AAASRR126 pKa = 11.84AIGPATVGAAVYY138 pKa = 8.32YY139 pKa = 10.71SPDD142 pKa = 3.13FFGVDD147 pKa = 3.67DD148 pKa = 3.89EE149 pKa = 4.53ATYY152 pKa = 11.32LEE154 pKa = 4.76ANAAYY159 pKa = 10.38ALADD163 pKa = 3.08KK164 pKa = 8.41WTVSGAVGHH173 pKa = 5.67QWLNVTDD180 pKa = 6.25DD181 pKa = 3.68YY182 pKa = 10.0TTWNVGLAYY191 pKa = 10.53ALTDD195 pKa = 3.5NLAVDD200 pKa = 4.03VRR202 pKa = 11.84YY203 pKa = 10.12HH204 pKa = 6.19DD205 pKa = 3.93TDD207 pKa = 3.03VDD209 pKa = 4.47GPLTDD214 pKa = 3.9DD215 pKa = 3.8RR216 pKa = 11.84FVVGLKK222 pKa = 10.64ASFF225 pKa = 3.45
Molecular weight: 23.81 kDa
Isoelectric point according different methods:
Protein with the highest isoelectric point:
>tr|A0A2S8W634|A0A2S8W634_9CAUL Pilus assembly protein TadE OS=Brevundimonas sp. MYb31 OX=1848616 GN=CQ026_09650 PE=4 SV=1
MM1 pKa = 7.35KK2 pKa = 9.4RR3 pKa = 11.84TYY5 pKa = 10.2QPSRR9 pKa = 11.84LVRR12 pKa = 11.84KK13 pKa = 8.99RR14 pKa = 11.84RR15 pKa = 11.84HH16 pKa = 4.7GFRR19 pKa = 11.84SRR21 pKa = 11.84MATKK25 pKa = 10.2NGQKK29 pKa = 9.53IVARR33 pKa = 11.84RR34 pKa = 11.84RR35 pKa = 11.84AKK37 pKa = 9.77GRR39 pKa = 11.84KK40 pKa = 9.04RR41 pKa = 11.84LTAA44 pKa = 4.18
MM1 pKa = 7.35KK2 pKa = 9.4RR3 pKa = 11.84TYY5 pKa = 10.2QPSRR9 pKa = 11.84LVRR12 pKa = 11.84KK13 pKa = 8.99RR14 pKa = 11.84RR15 pKa = 11.84HH16 pKa = 4.7GFRR19 pKa = 11.84SRR21 pKa = 11.84MATKK25 pKa = 10.2NGQKK29 pKa = 9.53IVARR33 pKa = 11.84RR34 pKa = 11.84RR35 pKa = 11.84AKK37 pKa = 9.77GRR39 pKa = 11.84KK40 pKa = 9.04RR41 pKa = 11.84LTAA44 pKa = 4.18
Molecular weight: 5.31 kDa
Isoelectric point according different methods:
Peptides (in silico digests for buttom-up proteomics)
Below you can find in silico digests of the whole proteome with Trypsin, Chymotrypsin, Trypsin+LysC, LysN, ArgC proteases suitable for different mass spec machines.| Try ESI |
 |
|---|
| ChTry ESI |
 |
|---|
| ArgC ESI |
 |
|---|
| LysN ESI |
 |
|---|
| TryLysC ESI |
 |
|---|
| Try MALDI |
 |
|---|
| ChTry MALDI |
 |
|---|
| ArgC MALDI |
 |
|---|
| LysN MALDI |
 |
|---|
| TryLysC MALDI |
 |
|---|
| Try LTQ |
 |
|---|
| ChTry LTQ |
 |
|---|
| ArgC LTQ |
 |
|---|
| LysN LTQ |
 |
|---|
| TryLysC LTQ |
 |
|---|
| Try MSlow |
 |
|---|
| ChTry MSlow |
 |
|---|
| ArgC MSlow |
 |
|---|
| LysN MSlow |
 |
|---|
| TryLysC MSlow |
 |
|---|
| Try MShigh |
 |
|---|
| ChTry MShigh |
 |
|---|
| ArgC MShigh |
 |
|---|
| LysN MShigh |
 |
|---|
| TryLysC MShigh |
 |
|---|
General Statistics
Number of major isoforms |
Number of additional isoforms |
Number of all proteins |
Number of amino acids |
Min. Seq. Length |
Max. Seq. Length |
Avg. Seq. Length |
Avg. Mol. Weight |
|---|---|---|---|---|---|---|---|
0 |
1021726 |
39 |
4438 |
318.3 |
34.27 |
Amino acid frequency
Ala |
Cys |
Asp |
Glu |
Phe |
Gly |
His |
Ile |
Lys |
Leu |
|---|---|---|---|---|---|---|---|---|---|
13.825 ± 0.068 | 0.685 ± 0.013 |
5.986 ± 0.036 | 5.605 ± 0.042 |
3.495 ± 0.026 | 8.935 ± 0.042 |
1.801 ± 0.025 | 4.444 ± 0.033 |
2.909 ± 0.035 | 9.961 ± 0.05 |
Met |
Asn |
Gln |
Pro |
Arg |
Ser |
Thr |
Val |
Trp |
Tyr |
|---|---|---|---|---|---|---|---|---|---|
2.314 ± 0.019 | 2.447 ± 0.032 |
5.362 ± 0.033 | 3.209 ± 0.026 |
7.292 ± 0.044 | 5.145 ± 0.037 |
5.353 ± 0.032 | 7.65 ± 0.04 |
1.474 ± 0.018 | 2.108 ± 0.023 |
Most of the basic statistics you can see at this page can be downloaded from this CSV file
Proteome-pI is available under Creative Commons Attribution-NoDerivs license, for more details see here
| Reference: Kozlowski LP. Proteome-pI 2.0: Proteome Isoelectric Point Database Update. Nucleic Acids Res. 2021, doi: 10.1093/nar/gkab944 | Contact: Lukasz P. Kozlowski |
