Prevotella brunnea
Taxonomy: cellular organisms; Bacteria; FCB group; Bacteroidetes/Chlorobi group; Bacteroidetes; Bacteroidia; Bacteroidales; Prevotellaceae; Prevotella
Average proteome isoelectric point is 6.9
Get precalculated fractions of proteins

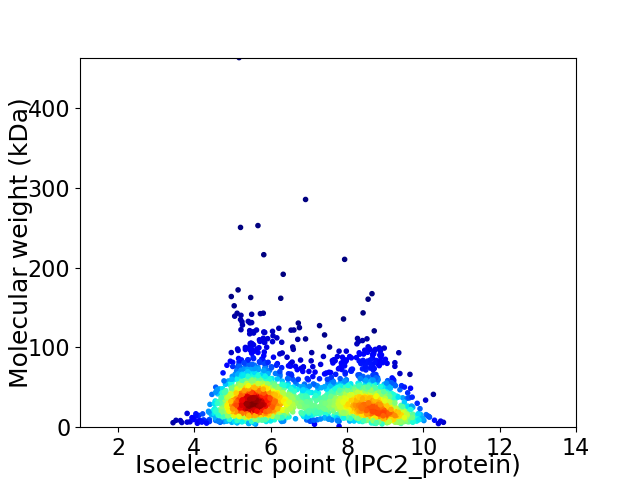
Virtual 2D-PAGE plot for 2080 proteins (isoelectric point calculated using IPC2_protein)
Get csv file with sequences according to given criteria:
* You can choose from 21 different methods for calculating isoelectric point
Summary statistics related to proteome-wise predictions


Protein with the lowest isoelectric point:
>tr|A0A5C8GDU6|A0A5C8GDU6_9BACT Uncharacterized protein OS=Prevotella brunnea OX=2508867 GN=ETF27_08565 PE=4 SV=1
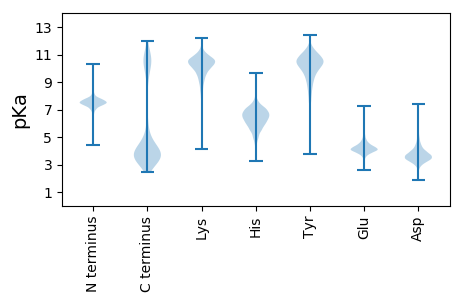
MM1 pKa = 7.29NRR3 pKa = 11.84TTEE6 pKa = 5.08KK7 pKa = 10.34IPTWSLCYY15 pKa = 10.25LINGDD20 pKa = 3.82ATALTDD26 pKa = 3.99DD27 pKa = 5.37EE28 pKa = 4.53IRR30 pKa = 11.84MVDD33 pKa = 3.11EE34 pKa = 5.66WVSQWQVEE42 pKa = 4.53IVSPLMDD49 pKa = 4.41EE50 pKa = 5.32DD51 pKa = 5.27GSTHH55 pKa = 7.26PYY57 pKa = 9.29FSHH60 pKa = 6.54YY61 pKa = 10.23PLFGLPTEE69 pKa = 4.68VEE71 pKa = 4.21DD72 pKa = 6.23CEE74 pKa = 4.79ILYY77 pKa = 11.05KK78 pKa = 10.52NDD80 pKa = 3.18NLL82 pKa = 4.48
MM1 pKa = 7.29NRR3 pKa = 11.84TTEE6 pKa = 5.08KK7 pKa = 10.34IPTWSLCYY15 pKa = 10.25LINGDD20 pKa = 3.82ATALTDD26 pKa = 3.99DD27 pKa = 5.37EE28 pKa = 4.53IRR30 pKa = 11.84MVDD33 pKa = 3.11EE34 pKa = 5.66WVSQWQVEE42 pKa = 4.53IVSPLMDD49 pKa = 4.41EE50 pKa = 5.32DD51 pKa = 5.27GSTHH55 pKa = 7.26PYY57 pKa = 9.29FSHH60 pKa = 6.54YY61 pKa = 10.23PLFGLPTEE69 pKa = 4.68VEE71 pKa = 4.21DD72 pKa = 6.23CEE74 pKa = 4.79ILYY77 pKa = 11.05KK78 pKa = 10.52NDD80 pKa = 3.18NLL82 pKa = 4.48
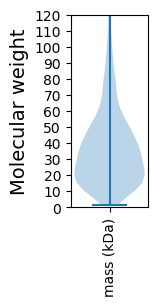
Molecular weight: 9.54 kDa
Isoelectric point according different methods:
Protein with the highest isoelectric point:
>tr|A0A5C8GBD4|A0A5C8GBD4_9BACT Site-specific integrase OS=Prevotella brunnea OX=2508867 GN=ETF27_09820 PE=4 SV=1
MM1 pKa = 7.35NGHH4 pKa = 6.47MPNCRR9 pKa = 11.84HH10 pKa = 4.6ITARR14 pKa = 11.84HH15 pKa = 4.46LTAIIAALLLLVMEE29 pKa = 5.69GCTSSRR35 pKa = 11.84FGEE38 pKa = 4.69GGHH41 pKa = 6.21TFRR44 pKa = 11.84QDD46 pKa = 2.83NPEE49 pKa = 3.38IDD51 pKa = 3.57RR52 pKa = 11.84RR53 pKa = 11.84FQIADD58 pKa = 3.38LGGQQLEE65 pKa = 3.98AATRR69 pKa = 11.84YY70 pKa = 9.97GLSKK74 pKa = 10.17PIRR77 pKa = 11.84RR78 pKa = 11.84RR79 pKa = 11.84SGIWLRR85 pKa = 11.84AWRR88 pKa = 11.84LRR90 pKa = 11.84KK91 pKa = 9.49IKK93 pKa = 9.18TNRR96 pKa = 11.84YY97 pKa = 8.44YY98 pKa = 11.26LLDD101 pKa = 4.33PMPHH105 pKa = 6.2SNPYY109 pKa = 8.14LTSGGKK115 pKa = 8.42WVLKK119 pKa = 9.53TIAKK123 pKa = 9.94RR124 pKa = 11.84FQKK127 pKa = 10.44KK128 pKa = 8.5LRR130 pKa = 11.84KK131 pKa = 9.34AGYY134 pKa = 8.0RR135 pKa = 11.84EE136 pKa = 3.54HH137 pKa = 7.47RR138 pKa = 11.84IIVTSMLRR146 pKa = 11.84TRR148 pKa = 11.84EE149 pKa = 4.23DD150 pKa = 2.68IGGLKK155 pKa = 10.11KK156 pKa = 10.28INRR159 pKa = 11.84VAATNSSHH167 pKa = 6.78MYY169 pKa = 8.37GTTFDD174 pKa = 3.5VSFTRR179 pKa = 11.84FNRR182 pKa = 11.84ISMDD186 pKa = 2.8GMQPSNHH193 pKa = 6.01LMANLLGEE201 pKa = 4.65VICEE205 pKa = 3.78LRR207 pKa = 11.84KK208 pKa = 10.38EE209 pKa = 4.41GEE211 pKa = 3.77CWIIFEE217 pKa = 4.55RR218 pKa = 11.84SQHH221 pKa = 5.68CFHH224 pKa = 6.02VTARR228 pKa = 11.84RR229 pKa = 3.41
MM1 pKa = 7.35NGHH4 pKa = 6.47MPNCRR9 pKa = 11.84HH10 pKa = 4.6ITARR14 pKa = 11.84HH15 pKa = 4.46LTAIIAALLLLVMEE29 pKa = 5.69GCTSSRR35 pKa = 11.84FGEE38 pKa = 4.69GGHH41 pKa = 6.21TFRR44 pKa = 11.84QDD46 pKa = 2.83NPEE49 pKa = 3.38IDD51 pKa = 3.57RR52 pKa = 11.84RR53 pKa = 11.84FQIADD58 pKa = 3.38LGGQQLEE65 pKa = 3.98AATRR69 pKa = 11.84YY70 pKa = 9.97GLSKK74 pKa = 10.17PIRR77 pKa = 11.84RR78 pKa = 11.84RR79 pKa = 11.84SGIWLRR85 pKa = 11.84AWRR88 pKa = 11.84LRR90 pKa = 11.84KK91 pKa = 9.49IKK93 pKa = 9.18TNRR96 pKa = 11.84YY97 pKa = 8.44YY98 pKa = 11.26LLDD101 pKa = 4.33PMPHH105 pKa = 6.2SNPYY109 pKa = 8.14LTSGGKK115 pKa = 8.42WVLKK119 pKa = 9.53TIAKK123 pKa = 9.94RR124 pKa = 11.84FQKK127 pKa = 10.44KK128 pKa = 8.5LRR130 pKa = 11.84KK131 pKa = 9.34AGYY134 pKa = 8.0RR135 pKa = 11.84EE136 pKa = 3.54HH137 pKa = 7.47RR138 pKa = 11.84IIVTSMLRR146 pKa = 11.84TRR148 pKa = 11.84EE149 pKa = 4.23DD150 pKa = 2.68IGGLKK155 pKa = 10.11KK156 pKa = 10.28INRR159 pKa = 11.84VAATNSSHH167 pKa = 6.78MYY169 pKa = 8.37GTTFDD174 pKa = 3.5VSFTRR179 pKa = 11.84FNRR182 pKa = 11.84ISMDD186 pKa = 2.8GMQPSNHH193 pKa = 6.01LMANLLGEE201 pKa = 4.65VICEE205 pKa = 3.78LRR207 pKa = 11.84KK208 pKa = 10.38EE209 pKa = 4.41GEE211 pKa = 3.77CWIIFEE217 pKa = 4.55RR218 pKa = 11.84SQHH221 pKa = 5.68CFHH224 pKa = 6.02VTARR228 pKa = 11.84RR229 pKa = 3.41
Molecular weight: 26.5 kDa
Isoelectric point according different methods:
Peptides (in silico digests for buttom-up proteomics)
Below you can find in silico digests of the whole proteome with Trypsin, Chymotrypsin, Trypsin+LysC, LysN, ArgC proteases suitable for different mass spec machines.| Try ESI |
 |
|---|
| ChTry ESI |
 |
|---|
| ArgC ESI |
 |
|---|
| LysN ESI |
 |
|---|
| TryLysC ESI |
 |
|---|
| Try MALDI |
 |
|---|
| ChTry MALDI |
 |
|---|
| ArgC MALDI |
 |
|---|
| LysN MALDI |
 |
|---|
| TryLysC MALDI |
 |
|---|
| Try LTQ |
 |
|---|
| ChTry LTQ |
 |
|---|
| ArgC LTQ |
 |
|---|
| LysN LTQ |
 |
|---|
| TryLysC LTQ |
 |
|---|
| Try MSlow |
 |
|---|
| ChTry MSlow |
 |
|---|
| ArgC MSlow |
 |
|---|
| LysN MSlow |
 |
|---|
| TryLysC MSlow |
 |
|---|
| Try MShigh |
 |
|---|
| ChTry MShigh |
 |
|---|
| ArgC MShigh |
 |
|---|
| LysN MShigh |
 |
|---|
| TryLysC MShigh |
 |
|---|
General Statistics
Number of major isoforms |
Number of additional isoforms |
Number of all proteins |
Number of amino acids |
Min. Seq. Length |
Max. Seq. Length |
Avg. Seq. Length |
Avg. Mol. Weight |
|---|---|---|---|---|---|---|---|
0 |
716885 |
10 |
4198 |
344.7 |
38.98 |
Amino acid frequency
Ala |
Cys |
Asp |
Glu |
Phe |
Gly |
His |
Ile |
Lys |
Leu |
|---|---|---|---|---|---|---|---|---|---|
6.981 ± 0.053 | 1.241 ± 0.022 |
5.53 ± 0.036 | 6.46 ± 0.055 |
4.584 ± 0.036 | 6.708 ± 0.052 |
2.06 ± 0.023 | 7.084 ± 0.053 |
7.172 ± 0.042 | 8.924 ± 0.057 |
Met |
Asn |
Gln |
Pro |
Arg |
Ser |
Thr |
Val |
Trp |
Tyr |
|---|---|---|---|---|---|---|---|---|---|
2.86 ± 0.026 | 5.325 ± 0.051 |
3.57 ± 0.027 | 3.49 ± 0.033 |
4.907 ± 0.045 | 5.899 ± 0.044 |
5.691 ± 0.04 | 6.219 ± 0.041 |
1.137 ± 0.021 | 4.156 ± 0.037 |
Most of the basic statistics you can see at this page can be downloaded from this CSV file
Proteome-pI is available under Creative Commons Attribution-NoDerivs license, for more details see here
| Reference: Kozlowski LP. Proteome-pI 2.0: Proteome Isoelectric Point Database Update. Nucleic Acids Res. 2021, doi: 10.1093/nar/gkab944 | Contact: Lukasz P. Kozlowski |
