Nesterenkonia natronophila
Taxonomy: cellular organisms; Bacteria; Terrabacteria group; Actinobacteria; Actinomycetia; Micrococcales; Micrococcaceae; Nesterenkonia
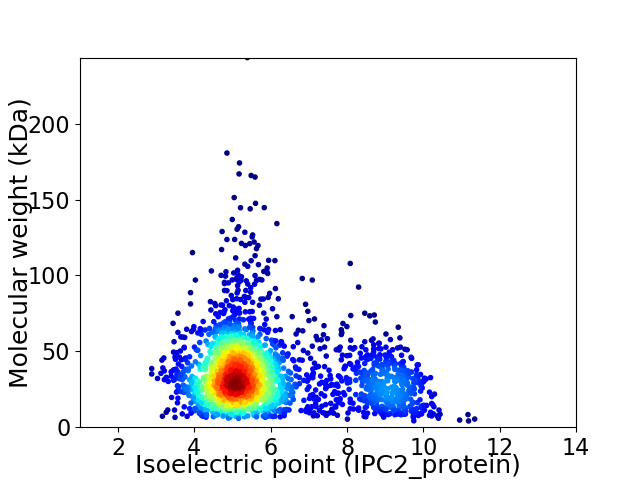
Average proteome isoelectric point is 5.97
Get precalculated fractions of proteins

Virtual 2D-PAGE plot for 2262 proteins (isoelectric point calculated using IPC2_protein)
Get csv file with sequences according to given criteria:
* You can choose from 21 different methods for calculating isoelectric point
Summary statistics related to proteome-wise predictions


Protein with the lowest isoelectric point:
>tr|A0A3A4F223|A0A3A4F223_9MICC Phospho-sugar mutase OS=Nesterenkonia natronophila OX=2174932 GN=D3250_08490 PE=3 SV=1
MM1 pKa = 7.34AAVGVVVLVVRR12 pKa = 11.84TCSTEE17 pKa = 3.96TEE19 pKa = 4.11PDD21 pKa = 3.3PTEE24 pKa = 4.7LGFPPAPVQEE34 pKa = 4.15QPVLSQATGQAGEE47 pKa = 4.21VPITDD52 pKa = 3.97LVDD55 pKa = 3.85SEE57 pKa = 4.67WVKK60 pKa = 10.08RR61 pKa = 11.84TAEE64 pKa = 3.93RR65 pKa = 11.84AEE67 pKa = 4.02IPHH70 pKa = 6.81RR71 pKa = 11.84AMEE74 pKa = 4.53SYY76 pKa = 10.98AGAAAYY82 pKa = 10.22AEE84 pKa = 4.54LTDD87 pKa = 5.03PDD89 pKa = 4.88CQLGWNTLAGIGQVEE104 pKa = 4.54SLHH107 pKa = 6.09GAFGGSSIGEE117 pKa = 4.41DD118 pKa = 3.52GVVDD122 pKa = 3.93PPIIGVALDD131 pKa = 3.93GSDD134 pKa = 3.44GLMEE138 pKa = 5.74IPDD141 pKa = 4.3TDD143 pKa = 5.45DD144 pKa = 4.2GDD146 pKa = 5.18LDD148 pKa = 6.14GDD150 pKa = 4.49DD151 pKa = 3.59EE152 pKa = 4.42WDD154 pKa = 3.59RR155 pKa = 11.84AVGPMQFIPTTWEE168 pKa = 3.61AFGQDD173 pKa = 3.8GNLSGQANIHH183 pKa = 5.91QYY185 pKa = 11.69DD186 pKa = 3.92DD187 pKa = 3.66AALAAAIYY195 pKa = 10.34LCDD198 pKa = 3.99SGDD201 pKa = 4.23DD202 pKa = 3.77LTEE205 pKa = 4.09DD206 pKa = 4.37RR207 pKa = 11.84GWNDD211 pKa = 4.45AIAAYY216 pKa = 9.52NQSIEE221 pKa = 4.18YY222 pKa = 9.67AHH224 pKa = 7.12DD225 pKa = 3.65VAHH228 pKa = 6.64HH229 pKa = 6.6AEE231 pKa = 4.66HH232 pKa = 6.18YY233 pKa = 10.88LKK235 pKa = 11.0DD236 pKa = 3.59EE237 pKa = 4.28
MM1 pKa = 7.34AAVGVVVLVVRR12 pKa = 11.84TCSTEE17 pKa = 3.96TEE19 pKa = 4.11PDD21 pKa = 3.3PTEE24 pKa = 4.7LGFPPAPVQEE34 pKa = 4.15QPVLSQATGQAGEE47 pKa = 4.21VPITDD52 pKa = 3.97LVDD55 pKa = 3.85SEE57 pKa = 4.67WVKK60 pKa = 10.08RR61 pKa = 11.84TAEE64 pKa = 3.93RR65 pKa = 11.84AEE67 pKa = 4.02IPHH70 pKa = 6.81RR71 pKa = 11.84AMEE74 pKa = 4.53SYY76 pKa = 10.98AGAAAYY82 pKa = 10.22AEE84 pKa = 4.54LTDD87 pKa = 5.03PDD89 pKa = 4.88CQLGWNTLAGIGQVEE104 pKa = 4.54SLHH107 pKa = 6.09GAFGGSSIGEE117 pKa = 4.41DD118 pKa = 3.52GVVDD122 pKa = 3.93PPIIGVALDD131 pKa = 3.93GSDD134 pKa = 3.44GLMEE138 pKa = 5.74IPDD141 pKa = 4.3TDD143 pKa = 5.45DD144 pKa = 4.2GDD146 pKa = 5.18LDD148 pKa = 6.14GDD150 pKa = 4.49DD151 pKa = 3.59EE152 pKa = 4.42WDD154 pKa = 3.59RR155 pKa = 11.84AVGPMQFIPTTWEE168 pKa = 3.61AFGQDD173 pKa = 3.8GNLSGQANIHH183 pKa = 5.91QYY185 pKa = 11.69DD186 pKa = 3.92DD187 pKa = 3.66AALAAAIYY195 pKa = 10.34LCDD198 pKa = 3.99SGDD201 pKa = 4.23DD202 pKa = 3.77LTEE205 pKa = 4.09DD206 pKa = 4.37RR207 pKa = 11.84GWNDD211 pKa = 4.45AIAAYY216 pKa = 9.52NQSIEE221 pKa = 4.18YY222 pKa = 9.67AHH224 pKa = 7.12DD225 pKa = 3.65VAHH228 pKa = 6.64HH229 pKa = 6.6AEE231 pKa = 4.66HH232 pKa = 6.18YY233 pKa = 10.88LKK235 pKa = 11.0DD236 pKa = 3.59EE237 pKa = 4.28
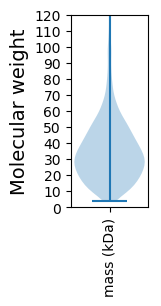
Molecular weight: 25.2 kDa
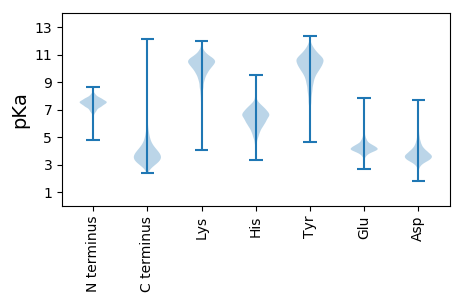
Isoelectric point according different methods:
Protein with the highest isoelectric point:
>tr|A0A3A4F4Y8|A0A3A4F4Y8_9MICC D-2-hydroxyacid dehydrogenase OS=Nesterenkonia natronophila OX=2174932 GN=D3250_02875 PE=3 SV=1
MM1 pKa = 7.69SKK3 pKa = 9.01RR4 pKa = 11.84TFQPSNRR11 pKa = 11.84RR12 pKa = 11.84RR13 pKa = 11.84SRR15 pKa = 11.84KK16 pKa = 8.87HH17 pKa = 4.83GFRR20 pKa = 11.84SRR22 pKa = 11.84MRR24 pKa = 11.84TRR26 pKa = 11.84AGRR29 pKa = 11.84SIISARR35 pKa = 11.84RR36 pKa = 11.84RR37 pKa = 11.84SGRR40 pKa = 11.84QKK42 pKa = 10.95LSAA45 pKa = 4.16
MM1 pKa = 7.69SKK3 pKa = 9.01RR4 pKa = 11.84TFQPSNRR11 pKa = 11.84RR12 pKa = 11.84RR13 pKa = 11.84SRR15 pKa = 11.84KK16 pKa = 8.87HH17 pKa = 4.83GFRR20 pKa = 11.84SRR22 pKa = 11.84MRR24 pKa = 11.84TRR26 pKa = 11.84AGRR29 pKa = 11.84SIISARR35 pKa = 11.84RR36 pKa = 11.84RR37 pKa = 11.84SGRR40 pKa = 11.84QKK42 pKa = 10.95LSAA45 pKa = 4.16
Molecular weight: 5.37 kDa
Isoelectric point according different methods:
Peptides (in silico digests for buttom-up proteomics)
Below you can find in silico digests of the whole proteome with Trypsin, Chymotrypsin, Trypsin+LysC, LysN, ArgC proteases suitable for different mass spec machines.| Try ESI |
 |
|---|
| ChTry ESI |
 |
|---|
| ArgC ESI |
 |
|---|
| LysN ESI |
 |
|---|
| TryLysC ESI |
 |
|---|
| Try MALDI |
 |
|---|
| ChTry MALDI |
 |
|---|
| ArgC MALDI |
 |
|---|
| LysN MALDI |
 |
|---|
| TryLysC MALDI |
 |
|---|
| Try LTQ |
 |
|---|
| ChTry LTQ |
 |
|---|
| ArgC LTQ |
 |
|---|
| LysN LTQ |
 |
|---|
| TryLysC LTQ |
 |
|---|
| Try MSlow |
 |
|---|
| ChTry MSlow |
 |
|---|
| ArgC MSlow |
 |
|---|
| LysN MSlow |
 |
|---|
| TryLysC MSlow |
 |
|---|
| Try MShigh |
 |
|---|
| ChTry MShigh |
 |
|---|
| ArgC MShigh |
 |
|---|
| LysN MShigh |
 |
|---|
| TryLysC MShigh |
 |
|---|
General Statistics
Number of major isoforms |
Number of additional isoforms |
Number of all proteins |
Number of amino acids |
Min. Seq. Length |
Max. Seq. Length |
Avg. Seq. Length |
Avg. Mol. Weight |
|---|---|---|---|---|---|---|---|
0 |
764907 |
32 |
2202 |
338.2 |
36.63 |
Amino acid frequency
Ala |
Cys |
Asp |
Glu |
Phe |
Gly |
His |
Ile |
Lys |
Leu |
|---|---|---|---|---|---|---|---|---|---|
11.835 ± 0.056 | 0.627 ± 0.011 |
5.821 ± 0.042 | 6.793 ± 0.055 |
3.125 ± 0.03 | 8.417 ± 0.043 |
2.405 ± 0.023 | 4.425 ± 0.036 |
2.472 ± 0.032 | 10.109 ± 0.057 |
Met |
Asn |
Gln |
Pro |
Arg |
Ser |
Thr |
Val |
Trp |
Tyr |
|---|---|---|---|---|---|---|---|---|---|
2.143 ± 0.018 | 2.255 ± 0.024 |
5.282 ± 0.035 | 3.624 ± 0.028 |
6.837 ± 0.046 | 6.094 ± 0.034 |
5.944 ± 0.031 | 8.266 ± 0.043 |
1.438 ± 0.021 | 2.087 ± 0.019 |
Most of the basic statistics you can see at this page can be downloaded from this CSV file
Proteome-pI is available under Creative Commons Attribution-NoDerivs license, for more details see here
| Reference: Kozlowski LP. Proteome-pI 2.0: Proteome Isoelectric Point Database Update. Nucleic Acids Res. 2021, doi: 10.1093/nar/gkab944 | Contact: Lukasz P. Kozlowski |
