Bactrocera dorsalis (Oriental fruit fly) (Dacus dorsalis)
Taxonomy: cellular organisms; Eukaryota; Opisthokonta; Metazoa; Eumetazoa; Bilateria; Protostomia; Ecdysozoa; Panarthropoda; Arthropoda; Mandibulata; Pancru
Average proteome isoelectric point is 6.68
Get precalculated fractions of proteins
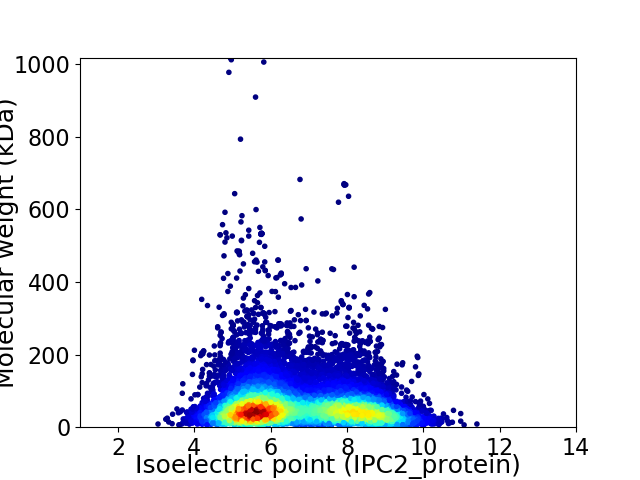
Virtual 2D-PAGE plot for 13409 proteins (isoelectric point calculated using IPC2_protein)
Get csv file with sequences according to given criteria:
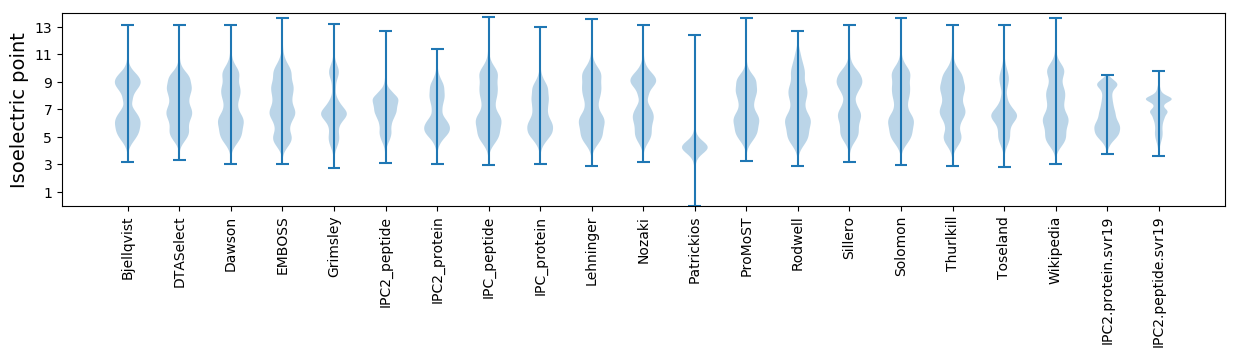
* You can choose from 21 different methods for calculating isoelectric point
Summary statistics related to proteome-wise predictions
Protein with the lowest isoelectric point:
>tr|A0A6I9V8K5|A0A6I9V8K5_BACDO probable cytochrome P450 12a5 mitochondrial OS=Bactrocera dorsalis OX=27457 GN=LOC105227637 PE=3 SV=1
MM1 pKa = 7.56KK2 pKa = 10.51LLTVFVLLAAIVAALGDD19 pKa = 4.05VPVNPDD25 pKa = 3.74DD26 pKa = 5.49SNVSTGDD33 pKa = 3.11STTIAGTAVPDD44 pKa = 4.5DD45 pKa = 4.77SNTSASSNLLASTDD59 pKa = 3.34TGTITSEE66 pKa = 3.91PTTVPTGEE74 pKa = 4.3TTSVATSEE82 pKa = 4.58GTTSTSSPATTTVEE96 pKa = 3.88PTTTVTTDD104 pKa = 2.87EE105 pKa = 4.45TTSVATSEE113 pKa = 4.14EE114 pKa = 4.65TTTVTTDD121 pKa = 3.15EE122 pKa = 4.43TASTSSPTTATTSSATSEE140 pKa = 4.39TSSTTPSTTTTVAPSEE156 pKa = 4.4TTPNTDD162 pKa = 2.71EE163 pKa = 4.39TTDD166 pKa = 3.2ATTDD170 pKa = 3.14EE171 pKa = 4.71TTNEE175 pKa = 4.04TTNATTNGTAASTATPDD192 pKa = 3.17PTTPGNTTTVAPSEE206 pKa = 4.4TTPNTDD212 pKa = 2.71EE213 pKa = 4.39TTDD216 pKa = 3.25ATTDD220 pKa = 2.92ATTNSTAASTVTPDD234 pKa = 3.25TTPVQNGSTEE244 pKa = 3.96APSANKK250 pKa = 8.92LQCYY254 pKa = 9.43ACEE257 pKa = 5.32GDD259 pKa = 4.56DD260 pKa = 4.16CDD262 pKa = 4.0EE263 pKa = 4.28KK264 pKa = 10.83TVINCPDD271 pKa = 3.83DD272 pKa = 3.6GRR274 pKa = 11.84AYY276 pKa = 10.44DD277 pKa = 4.44VEE279 pKa = 4.44DD280 pKa = 3.6TSKK283 pKa = 11.2SLSEE287 pKa = 3.96NAAEE291 pKa = 5.17ILLQNYY297 pKa = 9.48RR298 pKa = 11.84SVARR302 pKa = 11.84LEE304 pKa = 3.98LADD307 pKa = 3.62VKK309 pKa = 11.11GYY311 pKa = 10.9ACYY314 pKa = 9.91RR315 pKa = 11.84VQITDD320 pKa = 3.7NDD322 pKa = 3.91DD323 pKa = 3.28KK324 pKa = 11.46ALKK327 pKa = 9.64LGCITIPYY335 pKa = 8.49GQSACEE341 pKa = 3.75AVRR344 pKa = 11.84NEE346 pKa = 4.13LNITTTADD354 pKa = 3.18SDD356 pKa = 3.67EE357 pKa = 4.76CLACQTDD364 pKa = 4.21LCNGSAIAKK373 pKa = 9.95LSVAVLLSVLLAKK386 pKa = 10.44FLFF389 pKa = 4.42
MM1 pKa = 7.56KK2 pKa = 10.51LLTVFVLLAAIVAALGDD19 pKa = 4.05VPVNPDD25 pKa = 3.74DD26 pKa = 5.49SNVSTGDD33 pKa = 3.11STTIAGTAVPDD44 pKa = 4.5DD45 pKa = 4.77SNTSASSNLLASTDD59 pKa = 3.34TGTITSEE66 pKa = 3.91PTTVPTGEE74 pKa = 4.3TTSVATSEE82 pKa = 4.58GTTSTSSPATTTVEE96 pKa = 3.88PTTTVTTDD104 pKa = 2.87EE105 pKa = 4.45TTSVATSEE113 pKa = 4.14EE114 pKa = 4.65TTTVTTDD121 pKa = 3.15EE122 pKa = 4.43TASTSSPTTATTSSATSEE140 pKa = 4.39TSSTTPSTTTTVAPSEE156 pKa = 4.4TTPNTDD162 pKa = 2.71EE163 pKa = 4.39TTDD166 pKa = 3.2ATTDD170 pKa = 3.14EE171 pKa = 4.71TTNEE175 pKa = 4.04TTNATTNGTAASTATPDD192 pKa = 3.17PTTPGNTTTVAPSEE206 pKa = 4.4TTPNTDD212 pKa = 2.71EE213 pKa = 4.39TTDD216 pKa = 3.25ATTDD220 pKa = 2.92ATTNSTAASTVTPDD234 pKa = 3.25TTPVQNGSTEE244 pKa = 3.96APSANKK250 pKa = 8.92LQCYY254 pKa = 9.43ACEE257 pKa = 5.32GDD259 pKa = 4.56DD260 pKa = 4.16CDD262 pKa = 4.0EE263 pKa = 4.28KK264 pKa = 10.83TVINCPDD271 pKa = 3.83DD272 pKa = 3.6GRR274 pKa = 11.84AYY276 pKa = 10.44DD277 pKa = 4.44VEE279 pKa = 4.44DD280 pKa = 3.6TSKK283 pKa = 11.2SLSEE287 pKa = 3.96NAAEE291 pKa = 5.17ILLQNYY297 pKa = 9.48RR298 pKa = 11.84SVARR302 pKa = 11.84LEE304 pKa = 3.98LADD307 pKa = 3.62VKK309 pKa = 11.11GYY311 pKa = 10.9ACYY314 pKa = 9.91RR315 pKa = 11.84VQITDD320 pKa = 3.7NDD322 pKa = 3.91DD323 pKa = 3.28KK324 pKa = 11.46ALKK327 pKa = 9.64LGCITIPYY335 pKa = 8.49GQSACEE341 pKa = 3.75AVRR344 pKa = 11.84NEE346 pKa = 4.13LNITTTADD354 pKa = 3.18SDD356 pKa = 3.67EE357 pKa = 4.76CLACQTDD364 pKa = 4.21LCNGSAIAKK373 pKa = 9.95LSVAVLLSVLLAKK386 pKa = 10.44FLFF389 pKa = 4.42
Molecular weight: 39.73 kDa
Isoelectric point according different methods:
Protein with the highest isoelectric point:
>tr|A0A6I9V844|A0A6I9V844_BACDO Gustatory receptor OS=Bactrocera dorsalis OX=27457 GN=LOC105223070 PE=3 SV=1
MM1 pKa = 7.55PRR3 pKa = 11.84NFFMFLFGVALLVVLITLAQAQPPTTRR30 pKa = 11.84LISTTRR36 pKa = 11.84RR37 pKa = 11.84PTVRR41 pKa = 11.84PTSTRR46 pKa = 11.84RR47 pKa = 11.84PIPPTRR53 pKa = 11.84RR54 pKa = 11.84PVPTRR59 pKa = 11.84PRR61 pKa = 11.84RR62 pKa = 11.84PSPTRR67 pKa = 11.84RR68 pKa = 11.84PTPKK72 pKa = 9.87RR73 pKa = 11.84RR74 pKa = 11.84PSS76 pKa = 3.03
MM1 pKa = 7.55PRR3 pKa = 11.84NFFMFLFGVALLVVLITLAQAQPPTTRR30 pKa = 11.84LISTTRR36 pKa = 11.84RR37 pKa = 11.84PTVRR41 pKa = 11.84PTSTRR46 pKa = 11.84RR47 pKa = 11.84PIPPTRR53 pKa = 11.84RR54 pKa = 11.84PVPTRR59 pKa = 11.84PRR61 pKa = 11.84RR62 pKa = 11.84PSPTRR67 pKa = 11.84RR68 pKa = 11.84PTPKK72 pKa = 9.87RR73 pKa = 11.84RR74 pKa = 11.84PSS76 pKa = 3.03
Molecular weight: 8.77 kDa
Isoelectric point according different methods:
Peptides (in silico digests for buttom-up proteomics)
Below you can find in silico digests of the whole proteome with Trypsin, Chymotrypsin, Trypsin+LysC, LysN, ArgC proteases suitable for different mass spec machines.| Try ESI |
 |
|---|
| ChTry ESI |
|
|---|
| ArgC ESI |
|
|---|
| LysN ESI |
|
|---|
| TryLysC ESI |
|
|---|
| Try MALDI |
|
|---|
| ChTry MALDI |
|
|---|
| ArgC MALDI |
|
|---|
| LysN MALDI |
|
|---|
| TryLysC MALDI |
|
|---|
| Try LTQ |
|
|---|
| ChTry LTQ |
|
|---|
| ArgC LTQ |
|
|---|
| LysN LTQ |
|
|---|
| TryLysC LTQ |
|
|---|
| Try MSlow |
|
|---|
| ChTry MSlow |
|
|---|
| ArgC MSlow |
|
|---|
| LysN MSlow |
|
|---|
| TryLysC MSlow |
|
|---|
| Try MShigh |
|
|---|
| ChTry MShigh |
|
|---|
| ArgC MShigh |
|
|---|
| LysN MShigh |
|
|---|
| TryLysC MShigh |
|
|---|
General Statistics
Number of major isoforms |
Number of additional isoforms |
Number of all proteins |
Number of amino acids |
Min. Seq. Length |
Max. Seq. Length |
Avg. Seq. Length |
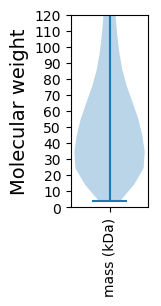
Avg. Mol. Weight |
|---|---|---|---|---|---|---|---|
8119786 |
36 |
9118 |
605.5 |
67.64 |
Amino acid frequency
Ala |
Cys |
Asp |
Glu |
Phe |
Gly |
His |
Ile |
Lys |
Leu |
|---|---|---|---|---|---|---|---|---|---|
7.297 ± 0.023 | 1.806 ± 0.015 |
5.222 ± 0.015 | 6.436 ± 0.026 |
3.533 ± 0.018 | 5.597 ± 0.025 |
2.584 ± 0.013 | 5.467 ± 0.017 |
6.012 ± 0.023 | 8.759 ± 0.028 |
Met |
Asn |
Gln |
Pro |
Arg |
Ser |
Thr |
Val |
Trp |
Tyr |
|---|---|---|---|---|---|---|---|---|---|
2.279 ± 0.008 | 5.616 ± 0.018 |
5.015 ± 0.025 | 4.94 ± 0.028 |
5.132 ± 0.017 | 8.247 ± 0.033 |
6.363 ± 0.023 | 5.749 ± 0.014 |
0.91 ± 0.007 | 3.029 ± 0.015 |
Most of the basic statistics you can see at this page can be downloaded from this CSV file
See this proteome in:

Proteome-pI is available under Creative Commons Attribution-NoDerivs license, for more details see here
| Reference: Kozlowski LP. Proteome-pI 2.0: Proteome Isoelectric Point Database Update. Nucleic Acids Res. 2021, doi: 10.1093/nar/gkab944 | Contact: Lukasz P. Kozlowski |