Euonymus yellow vein virus
Taxonomy: Viruses; Riboviria; Orthornavirae; Kitrinoviricota; Alsuviricetes; Tymovirales; Alphaflexiviridae; Potexvirus
Average proteome isoelectric point is 6.78
Get precalculated fractions of proteins

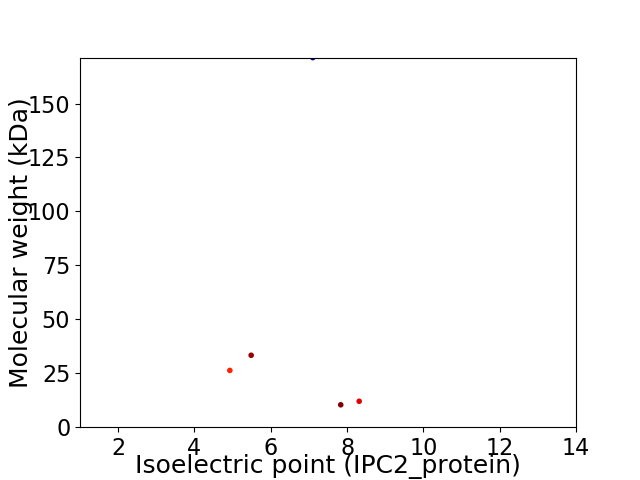
Virtual 2D-PAGE plot for 5 proteins (isoelectric point calculated using IPC2_protein)
Get csv file with sequences according to given criteria:
* You can choose from 21 different methods for calculating isoelectric point
Summary statistics related to proteome-wise predictions


Protein with the lowest isoelectric point:
>tr|A0A218MK54|A0A218MK54_9VIRU TGB 2 protein OS=Euonymus yellow vein virus OX=2013968 PE=4 SV=1
MM1 pKa = 7.41EE2 pKa = 4.53VLTRR6 pKa = 11.84LLNEE10 pKa = 3.71NRR12 pKa = 11.84FLRR15 pKa = 11.84TLEE18 pKa = 5.0PISKK22 pKa = 9.38PLVIHH27 pKa = 6.67ACAGAGKK34 pKa = 8.35STIIRR39 pKa = 11.84SVLNSVPGARR49 pKa = 11.84AYY51 pKa = 9.68TFGKK55 pKa = 10.24ADD57 pKa = 3.65KK58 pKa = 10.3KK59 pKa = 10.75NLSGQFIEE67 pKa = 5.52SACCHH72 pKa = 6.49PKK74 pKa = 10.35PEE76 pKa = 3.98ASFRR80 pKa = 11.84ILDD83 pKa = 4.0EE84 pKa = 4.26YY85 pKa = 11.22LVSDD89 pKa = 5.19DD90 pKa = 4.0GEE92 pKa = 4.21EE93 pKa = 4.02YY94 pKa = 10.91DD95 pKa = 6.15AVFCDD100 pKa = 3.72PLQVKK105 pKa = 8.05GTARR109 pKa = 11.84RR110 pKa = 11.84PHH112 pKa = 6.88FICTTSQRR120 pKa = 11.84FGWHH124 pKa = 5.31TADD127 pKa = 4.71LLRR130 pKa = 11.84KK131 pKa = 10.03LGIEE135 pKa = 4.13LNSSKK140 pKa = 10.84EE141 pKa = 3.95DD142 pKa = 3.41LVLIQPLFEE151 pKa = 4.66GEE153 pKa = 4.11PEE155 pKa = 4.25GVILAWEE162 pKa = 4.36PEE164 pKa = 4.29VCALLDD170 pKa = 3.51DD171 pKa = 4.8HH172 pKa = 7.16LVEE175 pKa = 4.95FKK177 pKa = 10.89KK178 pKa = 10.27PSEE181 pKa = 4.4VIGEE185 pKa = 4.31TFDD188 pKa = 3.72CVSVITEE195 pKa = 4.07SLIDD199 pKa = 3.7NVDD202 pKa = 4.0FEE204 pKa = 4.83SLYY207 pKa = 10.51VALSRR212 pKa = 11.84HH213 pKa = 5.22CEE215 pKa = 3.92KK216 pKa = 10.93LVVLSADD223 pKa = 3.5PRR225 pKa = 11.84DD226 pKa = 3.71LLLISDD232 pKa = 4.93ASHH235 pKa = 6.45SAA237 pKa = 3.05
MM1 pKa = 7.41EE2 pKa = 4.53VLTRR6 pKa = 11.84LLNEE10 pKa = 3.71NRR12 pKa = 11.84FLRR15 pKa = 11.84TLEE18 pKa = 5.0PISKK22 pKa = 9.38PLVIHH27 pKa = 6.67ACAGAGKK34 pKa = 8.35STIIRR39 pKa = 11.84SVLNSVPGARR49 pKa = 11.84AYY51 pKa = 9.68TFGKK55 pKa = 10.24ADD57 pKa = 3.65KK58 pKa = 10.3KK59 pKa = 10.75NLSGQFIEE67 pKa = 5.52SACCHH72 pKa = 6.49PKK74 pKa = 10.35PEE76 pKa = 3.98ASFRR80 pKa = 11.84ILDD83 pKa = 4.0EE84 pKa = 4.26YY85 pKa = 11.22LVSDD89 pKa = 5.19DD90 pKa = 4.0GEE92 pKa = 4.21EE93 pKa = 4.02YY94 pKa = 10.91DD95 pKa = 6.15AVFCDD100 pKa = 3.72PLQVKK105 pKa = 8.05GTARR109 pKa = 11.84RR110 pKa = 11.84PHH112 pKa = 6.88FICTTSQRR120 pKa = 11.84FGWHH124 pKa = 5.31TADD127 pKa = 4.71LLRR130 pKa = 11.84KK131 pKa = 10.03LGIEE135 pKa = 4.13LNSSKK140 pKa = 10.84EE141 pKa = 3.95DD142 pKa = 3.41LVLIQPLFEE151 pKa = 4.66GEE153 pKa = 4.11PEE155 pKa = 4.25GVILAWEE162 pKa = 4.36PEE164 pKa = 4.29VCALLDD170 pKa = 3.51DD171 pKa = 4.8HH172 pKa = 7.16LVEE175 pKa = 4.95FKK177 pKa = 10.89KK178 pKa = 10.27PSEE181 pKa = 4.4VIGEE185 pKa = 4.31TFDD188 pKa = 3.72CVSVITEE195 pKa = 4.07SLIDD199 pKa = 3.7NVDD202 pKa = 4.0FEE204 pKa = 4.83SLYY207 pKa = 10.51VALSRR212 pKa = 11.84HH213 pKa = 5.22CEE215 pKa = 3.92KK216 pKa = 10.93LVVLSADD223 pKa = 3.5PRR225 pKa = 11.84DD226 pKa = 3.71LLLISDD232 pKa = 4.93ASHH235 pKa = 6.45SAA237 pKa = 3.05
Molecular weight: 26.32 kDa
Isoelectric point according different methods:
Protein with the highest isoelectric point:
>tr|A0A218MK55|A0A218MK55_9VIRU RNA-directed RNA polymerase OS=Euonymus yellow vein virus OX=2013968 PE=4 SV=1
MM1 pKa = 7.93PLTPPRR7 pKa = 11.84DD8 pKa = 3.53YY9 pKa = 10.86STVFVVALAAFSLVAFTFTATRR31 pKa = 11.84STLPFVGDD39 pKa = 4.12NIHH42 pKa = 6.42SLAHH46 pKa = 5.93GGCYY50 pKa = 9.27RR51 pKa = 11.84DD52 pKa = 3.7GTKK55 pKa = 10.24SIQYY59 pKa = 8.19FPPTPVGSALKK70 pKa = 10.47GGYY73 pKa = 8.55LAAAITCIVIPGVLYY88 pKa = 10.44AVHH91 pKa = 7.24RR92 pKa = 11.84SNLHH96 pKa = 6.07CKK98 pKa = 9.3PVPCPNCRR106 pKa = 11.84THH108 pKa = 6.52VASPQQ113 pKa = 3.09
MM1 pKa = 7.93PLTPPRR7 pKa = 11.84DD8 pKa = 3.53YY9 pKa = 10.86STVFVVALAAFSLVAFTFTATRR31 pKa = 11.84STLPFVGDD39 pKa = 4.12NIHH42 pKa = 6.42SLAHH46 pKa = 5.93GGCYY50 pKa = 9.27RR51 pKa = 11.84DD52 pKa = 3.7GTKK55 pKa = 10.24SIQYY59 pKa = 8.19FPPTPVGSALKK70 pKa = 10.47GGYY73 pKa = 8.55LAAAITCIVIPGVLYY88 pKa = 10.44AVHH91 pKa = 7.24RR92 pKa = 11.84SNLHH96 pKa = 6.07CKK98 pKa = 9.3PVPCPNCRR106 pKa = 11.84THH108 pKa = 6.52VASPQQ113 pKa = 3.09
Molecular weight: 12.02 kDa
Isoelectric point according different methods:
Peptides (in silico digests for buttom-up proteomics)
Below you can find in silico digests of the whole proteome with Trypsin, Chymotrypsin, Trypsin+LysC, LysN, ArgC proteases suitable for different mass spec machines.| Try ESI |
 |
|---|
| ChTry ESI |
 |
|---|
| ArgC ESI |
 |
|---|
| LysN ESI |
 |
|---|
| TryLysC ESI |
 |
|---|
| Try MALDI |
 |
|---|
| ChTry MALDI |
 |
|---|
| ArgC MALDI |
 |
|---|
| LysN MALDI |
 |
|---|
| TryLysC MALDI |
 |
|---|
| Try LTQ |
 |
|---|
| ChTry LTQ |
 |
|---|
| ArgC LTQ |
 |
|---|
| LysN LTQ |
 |
|---|
| TryLysC LTQ |
 |
|---|
| Try MSlow |
 |
|---|
| ChTry MSlow |
 |
|---|
| ArgC MSlow |
 |
|---|
| LysN MSlow |
 |
|---|
| TryLysC MSlow |
 |
|---|
| Try MShigh |
 |
|---|
| ChTry MShigh |
 |
|---|
| ArgC MShigh |
 |
|---|
| LysN MShigh |
 |
|---|
| TryLysC MShigh |
 |
|---|
General Statistics
Number of major isoforms |
Number of additional isoforms |
Number of all proteins |
Number of amino acids |
Min. Seq. Length |
Max. Seq. Length |
Avg. Seq. Length |
Avg. Mol. Weight |
|---|---|---|---|---|---|---|---|
0 |
2258 |
93 |
1513 |
451.6 |
50.67 |
Amino acid frequency
Ala |
Cys |
Asp |
Glu |
Phe |
Gly |
His |
Ile |
Lys |
Leu |
|---|---|---|---|---|---|---|---|---|---|
8.193 ± 1.267 | 1.949 ± 0.491 |
5.27 ± 0.363 | 7.396 ± 0.716 |
4.163 ± 0.138 | 5.447 ± 0.655 |
2.613 ± 0.265 | 5.314 ± 0.407 |
6.687 ± 1.456 | 8.725 ± 0.975 |
Met |
Asn |
Gln |
Pro |
Arg |
Ser |
Thr |
Val |
Trp |
Tyr |
|---|---|---|---|---|---|---|---|---|---|
2.037 ± 0.373 | 3.676 ± 0.4 |
5.757 ± 0.423 | 4.03 ± 0.667 |
5.624 ± 0.569 | 6.776 ± 0.438 |
6.599 ± 0.592 | 5.802 ± 0.827 |
1.151 ± 0.116 | 2.79 ± 0.303 |
Most of the basic statistics you can see at this page can be downloaded from this CSV file
Proteome-pI is available under Creative Commons Attribution-NoDerivs license, for more details see here
| Reference: Kozlowski LP. Proteome-pI 2.0: Proteome Isoelectric Point Database Update. Nucleic Acids Res. 2021, doi: 10.1093/nar/gkab944 | Contact: Lukasz P. Kozlowski |
