Micromonospora rosaria
Taxonomy: cellular organisms;
Average proteome isoelectric point is 6.6
Get precalculated fractions of proteins

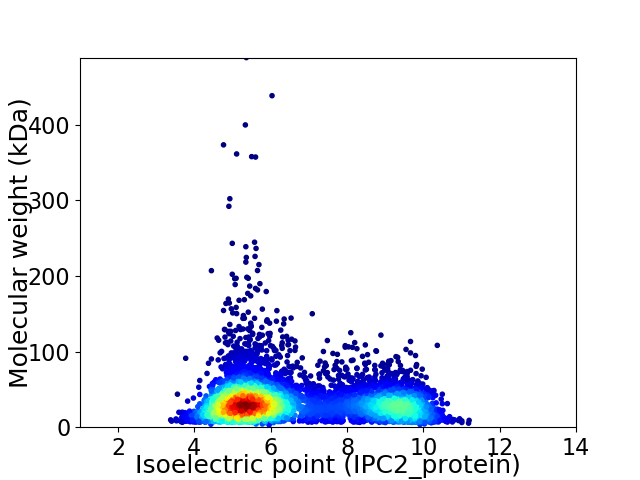
Virtual 2D-PAGE plot for 5974 proteins (isoelectric point calculated using IPC2_protein)
Get csv file with sequences according to given criteria:
* You can choose from 21 different methods for calculating isoelectric point
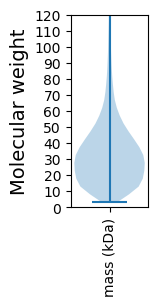
Summary statistics related to proteome-wise predictions


Protein with the lowest isoelectric point:
>tr|A0A136PWW5|A0A136PWW5_9ACTN RNA helicase OS=Micromonospora rosaria OX=47874 GN=AWW66_05780 PE=4 SV=1
MM1 pKa = 7.26VNNSKK6 pKa = 10.05IDD8 pKa = 3.7DD9 pKa = 3.68EE10 pKa = 4.35NAIVFQQQPSQPADD24 pKa = 3.35MYY26 pKa = 11.5SLAWLSKK33 pKa = 8.09MCHH36 pKa = 6.49AGTSITFKK44 pKa = 9.15WTIDD48 pKa = 3.49YY49 pKa = 11.04NFVWGQTGTLKK60 pKa = 10.8PGVDD64 pKa = 3.82YY65 pKa = 10.78EE66 pKa = 4.34AGQIIPADD74 pKa = 3.78LQNQNMVTLSYY85 pKa = 10.59IDD87 pKa = 4.52DD88 pKa = 4.03GFEE91 pKa = 4.21FGTPTSGAAPGSLLITEE108 pKa = 5.18DD109 pKa = 3.48EE110 pKa = 4.53TVPGPGLATQGSVGIGMSGAGTFVVPTQPKK140 pKa = 8.93TGAQFLLTPTYY151 pKa = 8.81WLAFGSYY158 pKa = 10.08KK159 pKa = 10.69AGTVVTEE166 pKa = 5.19DD167 pKa = 3.86ILTEE171 pKa = 4.62PYY173 pKa = 9.55QLKK176 pKa = 10.39YY177 pKa = 10.42PDD179 pKa = 4.58GEE181 pKa = 4.27TDD183 pKa = 2.91ATAVFDD189 pKa = 4.21GEE191 pKa = 3.99NWTITFGG198 pKa = 3.72
MM1 pKa = 7.26VNNSKK6 pKa = 10.05IDD8 pKa = 3.7DD9 pKa = 3.68EE10 pKa = 4.35NAIVFQQQPSQPADD24 pKa = 3.35MYY26 pKa = 11.5SLAWLSKK33 pKa = 8.09MCHH36 pKa = 6.49AGTSITFKK44 pKa = 9.15WTIDD48 pKa = 3.49YY49 pKa = 11.04NFVWGQTGTLKK60 pKa = 10.8PGVDD64 pKa = 3.82YY65 pKa = 10.78EE66 pKa = 4.34AGQIIPADD74 pKa = 3.78LQNQNMVTLSYY85 pKa = 10.59IDD87 pKa = 4.52DD88 pKa = 4.03GFEE91 pKa = 4.21FGTPTSGAAPGSLLITEE108 pKa = 5.18DD109 pKa = 3.48EE110 pKa = 4.53TVPGPGLATQGSVGIGMSGAGTFVVPTQPKK140 pKa = 8.93TGAQFLLTPTYY151 pKa = 8.81WLAFGSYY158 pKa = 10.08KK159 pKa = 10.69AGTVVTEE166 pKa = 5.19DD167 pKa = 3.86ILTEE171 pKa = 4.62PYY173 pKa = 9.55QLKK176 pKa = 10.39YY177 pKa = 10.42PDD179 pKa = 4.58GEE181 pKa = 4.27TDD183 pKa = 2.91ATAVFDD189 pKa = 4.21GEE191 pKa = 3.99NWTITFGG198 pKa = 3.72
Molecular weight: 21.29 kDa
Isoelectric point according different methods:
Protein with the highest isoelectric point:
>tr|A0A136PQQ5|A0A136PQQ5_9ACTN Metalloenzyme domain-containing protein OS=Micromonospora rosaria OX=47874 GN=AWW66_17295 PE=4 SV=1
MM1 pKa = 7.22AAARR5 pKa = 11.84GRR7 pKa = 11.84RR8 pKa = 11.84GLAGARR14 pKa = 11.84RR15 pKa = 11.84RR16 pKa = 11.84WRR18 pKa = 11.84RR19 pKa = 11.84TAGLRR24 pKa = 11.84QVPQRR29 pKa = 11.84RR30 pKa = 11.84GGWLGVPRR38 pKa = 11.84GGPAVPGGRR47 pKa = 11.84LPPLRR52 pKa = 11.84QRR54 pKa = 11.84GVQRR58 pKa = 11.84RR59 pKa = 11.84LLRR62 pKa = 11.84AGRR65 pKa = 11.84RR66 pKa = 11.84LLVRR70 pKa = 11.84ILWLAGAGWSEE81 pKa = 4.17GG82 pKa = 3.56
MM1 pKa = 7.22AAARR5 pKa = 11.84GRR7 pKa = 11.84RR8 pKa = 11.84GLAGARR14 pKa = 11.84RR15 pKa = 11.84RR16 pKa = 11.84WRR18 pKa = 11.84RR19 pKa = 11.84TAGLRR24 pKa = 11.84QVPQRR29 pKa = 11.84RR30 pKa = 11.84GGWLGVPRR38 pKa = 11.84GGPAVPGGRR47 pKa = 11.84LPPLRR52 pKa = 11.84QRR54 pKa = 11.84GVQRR58 pKa = 11.84RR59 pKa = 11.84LLRR62 pKa = 11.84AGRR65 pKa = 11.84RR66 pKa = 11.84LLVRR70 pKa = 11.84ILWLAGAGWSEE81 pKa = 4.17GG82 pKa = 3.56
Molecular weight: 9.06 kDa
Isoelectric point according different methods:
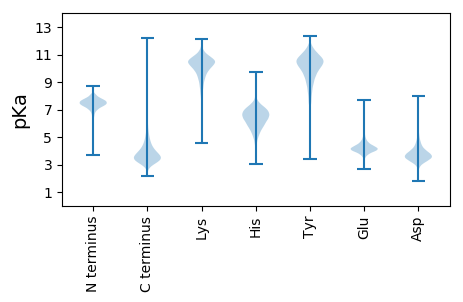
Peptides (in silico digests for buttom-up proteomics)
Below you can find in silico digests of the whole proteome with Trypsin, Chymotrypsin, Trypsin+LysC, LysN, ArgC proteases suitable for different mass spec machines.| Try ESI |
 |
|---|
| ChTry ESI |
 |
|---|
| ArgC ESI |
 |
|---|
| LysN ESI |
 |
|---|
| TryLysC ESI |
 |
|---|
| Try MALDI |
 |
|---|
| ChTry MALDI |
 |
|---|
| ArgC MALDI |
 |
|---|
| LysN MALDI |
 |
|---|
| TryLysC MALDI |
 |
|---|
| Try LTQ |
 |
|---|
| ChTry LTQ |
 |
|---|
| ArgC LTQ |
 |
|---|
| LysN LTQ |
 |
|---|
| TryLysC LTQ |
 |
|---|
| Try MSlow |
 |
|---|
| ChTry MSlow |
 |
|---|
| ArgC MSlow |
 |
|---|
| LysN MSlow |
 |
|---|
| TryLysC MSlow |
 |
|---|
| Try MShigh |
 |
|---|
| ChTry MShigh |
 |
|---|
| ArgC MShigh |
 |
|---|
| LysN MShigh |
 |
|---|
| TryLysC MShigh |
 |
|---|
General Statistics
Number of major isoforms |
Number of additional isoforms |
Number of all proteins |
Number of amino acids |
Min. Seq. Length |
Max. Seq. Length |
Avg. Seq. Length |
Avg. Mol. Weight |
|---|---|---|---|---|---|---|---|
0 |
1999827 |
29 |
4602 |
334.8 |
35.77 |
Amino acid frequency
Ala |
Cys |
Asp |
Glu |
Phe |
Gly |
His |
Ile |
Lys |
Leu |
|---|---|---|---|---|---|---|---|---|---|
13.951 ± 0.051 | 0.742 ± 0.009 |
6.135 ± 0.025 | 4.973 ± 0.029 |
2.594 ± 0.016 | 9.473 ± 0.029 |
2.199 ± 0.014 | 2.931 ± 0.021 |
1.419 ± 0.022 | 10.601 ± 0.042 |
Met |
Asn |
Gln |
Pro |
Arg |
Ser |
Thr |
Val |
Trp |
Tyr |
|---|---|---|---|---|---|---|---|---|---|
1.514 ± 0.012 | 1.688 ± 0.019 |
6.504 ± 0.033 | 2.718 ± 0.018 |
8.684 ± 0.034 | 4.45 ± 0.024 |
6.42 ± 0.032 | 9.326 ± 0.032 |
1.591 ± 0.012 | 2.087 ± 0.016 |
Most of the basic statistics you can see at this page can be downloaded from this CSV file
Proteome-pI is available under Creative Commons Attribution-NoDerivs license, for more details see here
| Reference: Kozlowski LP. Proteome-pI 2.0: Proteome Isoelectric Point Database Update. Nucleic Acids Res. 2021, doi: 10.1093/nar/gkab944 | Contact: Lukasz P. Kozlowski |
