Bordetella sp. N
Taxonomy: cellular organisms; Bacteria; Proteobacteria; Betaproteobacteria; Burkholderiales; Alcaligenaceae; Bordetella; unclassified Bordetella
Average proteome isoelectric point is 6.79
Get precalculated fractions of proteins
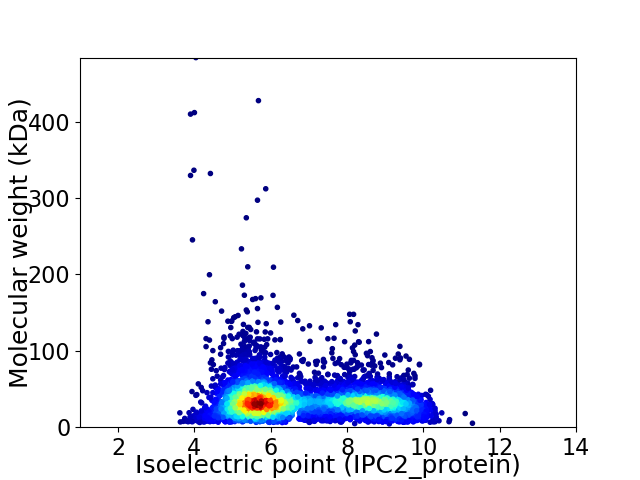
Virtual 2D-PAGE plot for 5821 proteins (isoelectric point calculated using IPC2_protein)
Get csv file with sequences according to given criteria:
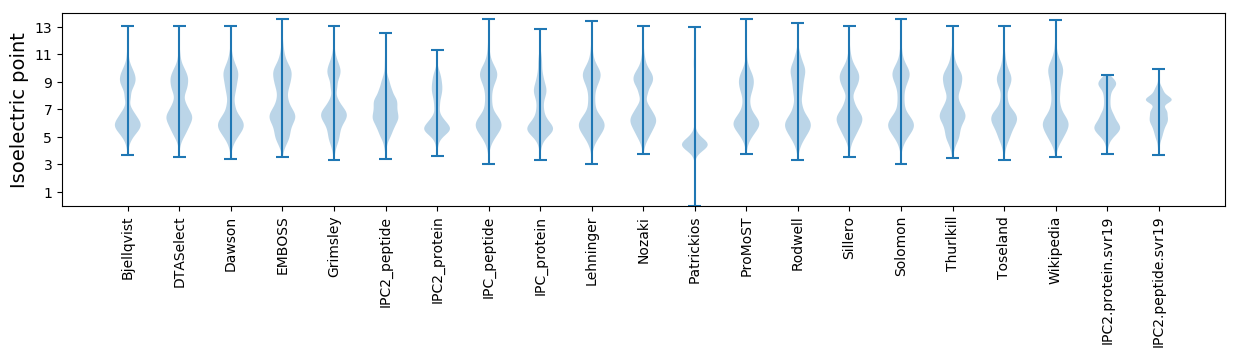
* You can choose from 21 different methods for calculating isoelectric point
Summary statistics related to proteome-wise predictions
Protein with the lowest isoelectric point:
>tr|A0A0S1Y2K9|A0A0S1Y2K9_9BORD Type IV secretion protein Rhs OS=Bordetella sp. N OX=1746199 GN=ASB57_15985 PE=3 SV=1
MM1 pKa = 6.91NTDD4 pKa = 3.08TSSIDD9 pKa = 3.42TPTAQPLRR17 pKa = 11.84TWQCILCGFVYY28 pKa = 10.64DD29 pKa = 4.47EE30 pKa = 4.26ATGLPEE36 pKa = 4.01EE37 pKa = 5.3GIPAGTRR44 pKa = 11.84WEE46 pKa = 4.5DD47 pKa = 4.3VPDD50 pKa = 3.26TWICPDD56 pKa = 3.92CSATKK61 pKa = 10.66ADD63 pKa = 4.25FEE65 pKa = 4.81MIAII69 pKa = 4.76
MM1 pKa = 6.91NTDD4 pKa = 3.08TSSIDD9 pKa = 3.42TPTAQPLRR17 pKa = 11.84TWQCILCGFVYY28 pKa = 10.64DD29 pKa = 4.47EE30 pKa = 4.26ATGLPEE36 pKa = 4.01EE37 pKa = 5.3GIPAGTRR44 pKa = 11.84WEE46 pKa = 4.5DD47 pKa = 4.3VPDD50 pKa = 3.26TWICPDD56 pKa = 3.92CSATKK61 pKa = 10.66ADD63 pKa = 4.25FEE65 pKa = 4.81MIAII69 pKa = 4.76
Molecular weight: 7.6 kDa
Isoelectric point according different methods:
Protein with the highest isoelectric point:
>tr|A0A0S1Y5V1|A0A0S1Y5V1_9BORD Threonine aldolase OS=Bordetella sp. N OX=1746199 GN=ASB57_23095 PE=3 SV=1
MM1 pKa = 7.45KK2 pKa = 9.51RR3 pKa = 11.84TFQPSVTRR11 pKa = 11.84RR12 pKa = 11.84KK13 pKa = 8.0RR14 pKa = 11.84THH16 pKa = 5.76GFRR19 pKa = 11.84VRR21 pKa = 11.84MKK23 pKa = 9.39TRR25 pKa = 11.84GGRR28 pKa = 11.84AVLNARR34 pKa = 11.84RR35 pKa = 11.84AKK37 pKa = 9.65GRR39 pKa = 11.84KK40 pKa = 8.75RR41 pKa = 11.84LAVV44 pKa = 3.41
MM1 pKa = 7.45KK2 pKa = 9.51RR3 pKa = 11.84TFQPSVTRR11 pKa = 11.84RR12 pKa = 11.84KK13 pKa = 8.0RR14 pKa = 11.84THH16 pKa = 5.76GFRR19 pKa = 11.84VRR21 pKa = 11.84MKK23 pKa = 9.39TRR25 pKa = 11.84GGRR28 pKa = 11.84AVLNARR34 pKa = 11.84RR35 pKa = 11.84AKK37 pKa = 9.65GRR39 pKa = 11.84KK40 pKa = 8.75RR41 pKa = 11.84LAVV44 pKa = 3.41
Molecular weight: 5.19 kDa
Isoelectric point according different methods:
Peptides (in silico digests for buttom-up proteomics)
Below you can find in silico digests of the whole proteome with Trypsin, Chymotrypsin, Trypsin+LysC, LysN, ArgC proteases suitable for different mass spec machines.| Try ESI |
 |
|---|
| ChTry ESI |
|
|---|
| ArgC ESI |
|
|---|
| LysN ESI |
|
|---|
| TryLysC ESI |
|
|---|
| Try MALDI |
|
|---|
| ChTry MALDI |
|
|---|
| ArgC MALDI |
|
|---|
| LysN MALDI |
|
|---|
| TryLysC MALDI |
|
|---|
| Try LTQ |
|
|---|
| ChTry LTQ |
|
|---|
| ArgC LTQ |
|
|---|
| LysN LTQ |
|
|---|
| TryLysC LTQ |
|
|---|
| Try MSlow |
|
|---|
| ChTry MSlow |
|
|---|
| ArgC MSlow |
|
|---|
| LysN MSlow |
|
|---|
| TryLysC MSlow |
|
|---|
| Try MShigh |
|
|---|
| ChTry MShigh |
|
|---|
| ArgC MShigh |
|
|---|
| LysN MShigh |
|
|---|
| TryLysC MShigh |
|
|---|
General Statistics
Number of major isoforms |
Number of additional isoforms |
Number of all proteins |
Number of amino acids |
Min. Seq. Length |
Max. Seq. Length |
Avg. Seq. Length |
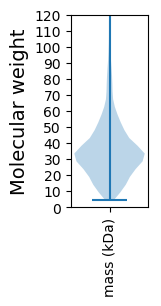
Avg. Mol. Weight |
|---|---|---|---|---|---|---|---|
0 |
2020596 |
43 |
4907 |
347.1 |
37.48 |
Amino acid frequency
Ala |
Cys |
Asp |
Glu |
Phe |
Gly |
His |
Ile |
Lys |
Leu |
|---|---|---|---|---|---|---|---|---|---|
12.949 ± 0.047 | 0.815 ± 0.01 |
5.609 ± 0.025 | 4.777 ± 0.036 |
3.304 ± 0.02 | 8.649 ± 0.052 |
2.143 ± 0.015 | 4.525 ± 0.021 |
2.985 ± 0.028 | 10.598 ± 0.042 |
Met |
Asn |
Gln |
Pro |
Arg |
Ser |
Thr |
Val |
Trp |
Tyr |
|---|---|---|---|---|---|---|---|---|---|
2.4 ± 0.016 | 2.719 ± 0.025 |
5.319 ± 0.026 | 3.853 ± 0.02 |
6.897 ± 0.041 | 5.4 ± 0.027 |
5.548 ± 0.049 | 7.713 ± 0.025 |
1.351 ± 0.011 | 2.448 ± 0.016 |
Most of the basic statistics you can see at this page can be downloaded from this CSV file
See this proteome in:

Proteome-pI is available under Creative Commons Attribution-NoDerivs license, for more details see here
| Reference: Kozlowski LP. Proteome-pI 2.0: Proteome Isoelectric Point Database Update. Nucleic Acids Res. 2021, doi: 10.1093/nar/gkab944 | Contact: Lukasz P. Kozlowski |