Micromonospora craniellae
Taxonomy: cellular organisms; Bacteria; Terrabacteria group; Actinobacteria; Actinomycetia; Micromonosporales; Micromonosporaceae; Micromonospora
Average proteome isoelectric point is 6.57
Get precalculated fractions of proteins

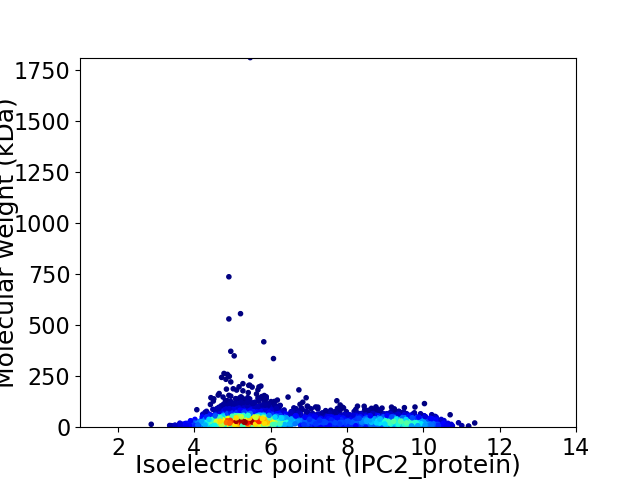
Virtual 2D-PAGE plot for 5663 proteins (isoelectric point calculated using IPC2_protein)
Get csv file with sequences according to given criteria:
* You can choose from 21 different methods for calculating isoelectric point
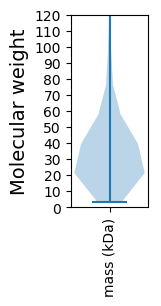
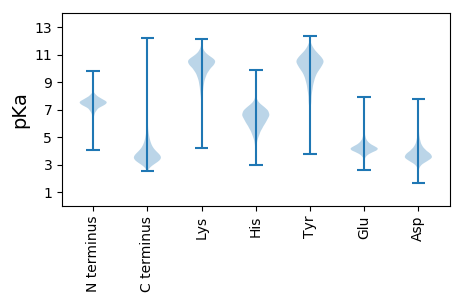
Summary statistics related to proteome-wise predictions


Protein with the lowest isoelectric point:
>tr|A0A372FUU1|A0A372FUU1_9ACTN DUF1540 domain-containing protein OS=Micromonospora craniellae OX=2294034 GN=D0Q02_21710 PE=4 SV=1
MM1 pKa = 7.7TDD3 pKa = 4.1SPQQTYY9 pKa = 11.4DD10 pKa = 3.28DD11 pKa = 4.02AAAILSSALDD21 pKa = 3.83GNSDD25 pKa = 3.8GVVGTFDD32 pKa = 3.96AVVDD36 pKa = 3.93RR37 pKa = 11.84AGLVGAYY44 pKa = 9.73DD45 pKa = 3.97VAWCLAATMVGDD57 pKa = 4.16PVPPGACALEE67 pKa = 4.53FPDD70 pKa = 4.9IDD72 pKa = 3.64QAEE75 pKa = 4.14YY76 pKa = 10.35DD77 pKa = 4.02ARR79 pKa = 11.84WVARR83 pKa = 11.84FVSAYY88 pKa = 10.46ANSDD92 pKa = 3.35LDD94 pKa = 3.49TARR97 pKa = 11.84ALFGAAVADD106 pKa = 4.18GLLPEE111 pKa = 5.09CLLTLAGSTVATLRR125 pKa = 11.84HH126 pKa = 5.68RR127 pKa = 11.84AAA129 pKa = 4.48
MM1 pKa = 7.7TDD3 pKa = 4.1SPQQTYY9 pKa = 11.4DD10 pKa = 3.28DD11 pKa = 4.02AAAILSSALDD21 pKa = 3.83GNSDD25 pKa = 3.8GVVGTFDD32 pKa = 3.96AVVDD36 pKa = 3.93RR37 pKa = 11.84AGLVGAYY44 pKa = 9.73DD45 pKa = 3.97VAWCLAATMVGDD57 pKa = 4.16PVPPGACALEE67 pKa = 4.53FPDD70 pKa = 4.9IDD72 pKa = 3.64QAEE75 pKa = 4.14YY76 pKa = 10.35DD77 pKa = 4.02ARR79 pKa = 11.84WVARR83 pKa = 11.84FVSAYY88 pKa = 10.46ANSDD92 pKa = 3.35LDD94 pKa = 3.49TARR97 pKa = 11.84ALFGAAVADD106 pKa = 4.18GLLPEE111 pKa = 5.09CLLTLAGSTVATLRR125 pKa = 11.84HH126 pKa = 5.68RR127 pKa = 11.84AAA129 pKa = 4.48
Molecular weight: 13.31 kDa
Isoelectric point according different methods:
Protein with the highest isoelectric point:
>tr|A0A372FR97|A0A372FR97_9ACTN Uncharacterized protein OS=Micromonospora craniellae OX=2294034 GN=D0Q02_29575 PE=4 SV=1
MM1 pKa = 7.13AQAAIRR7 pKa = 11.84KK8 pKa = 6.63NTGAGTAASSRR19 pKa = 11.84TAAKK23 pKa = 8.13RR24 pKa = 11.84TSPATTRR31 pKa = 11.84STGTAAARR39 pKa = 11.84KK40 pKa = 4.94TTATATGSRR49 pKa = 11.84AATSKK54 pKa = 10.75AAASTTGARR63 pKa = 11.84KK64 pKa = 6.33TTGSKK69 pKa = 9.28ATGSKK74 pKa = 10.38AATAKK79 pKa = 9.05ATSRR83 pKa = 11.84RR84 pKa = 11.84TTAGTAAATSARR96 pKa = 11.84TARR99 pKa = 11.84KK100 pKa = 9.13KK101 pKa = 10.59AVSATAGPTRR111 pKa = 11.84RR112 pKa = 11.84PTAKK116 pKa = 9.31ATAARR121 pKa = 11.84KK122 pKa = 7.92ATTAKK127 pKa = 9.35ATAAKK132 pKa = 9.6KK133 pKa = 10.56APAAKK138 pKa = 8.63KK139 pKa = 6.65TTVAKK144 pKa = 10.27KK145 pKa = 9.95AAAKK149 pKa = 9.28RR150 pKa = 11.84APASRR155 pKa = 11.84AAGGRR160 pKa = 11.84APATKK165 pKa = 9.34STAKK169 pKa = 10.25KK170 pKa = 9.5AATRR174 pKa = 11.84KK175 pKa = 8.09TSATQATAARR185 pKa = 11.84SRR187 pKa = 11.84AAGAPKK193 pKa = 10.04RR194 pKa = 11.84RR195 pKa = 11.84ATTMEE200 pKa = 4.02SFGSRR205 pKa = 11.84RR206 pKa = 11.84GARR209 pKa = 11.84TRR211 pKa = 3.3
MM1 pKa = 7.13AQAAIRR7 pKa = 11.84KK8 pKa = 6.63NTGAGTAASSRR19 pKa = 11.84TAAKK23 pKa = 8.13RR24 pKa = 11.84TSPATTRR31 pKa = 11.84STGTAAARR39 pKa = 11.84KK40 pKa = 4.94TTATATGSRR49 pKa = 11.84AATSKK54 pKa = 10.75AAASTTGARR63 pKa = 11.84KK64 pKa = 6.33TTGSKK69 pKa = 9.28ATGSKK74 pKa = 10.38AATAKK79 pKa = 9.05ATSRR83 pKa = 11.84RR84 pKa = 11.84TTAGTAAATSARR96 pKa = 11.84TARR99 pKa = 11.84KK100 pKa = 9.13KK101 pKa = 10.59AVSATAGPTRR111 pKa = 11.84RR112 pKa = 11.84PTAKK116 pKa = 9.31ATAARR121 pKa = 11.84KK122 pKa = 7.92ATTAKK127 pKa = 9.35ATAAKK132 pKa = 9.6KK133 pKa = 10.56APAAKK138 pKa = 8.63KK139 pKa = 6.65TTVAKK144 pKa = 10.27KK145 pKa = 9.95AAAKK149 pKa = 9.28RR150 pKa = 11.84APASRR155 pKa = 11.84AAGGRR160 pKa = 11.84APATKK165 pKa = 9.34STAKK169 pKa = 10.25KK170 pKa = 9.5AATRR174 pKa = 11.84KK175 pKa = 8.09TSATQATAARR185 pKa = 11.84SRR187 pKa = 11.84AAGAPKK193 pKa = 10.04RR194 pKa = 11.84RR195 pKa = 11.84ATTMEE200 pKa = 4.02SFGSRR205 pKa = 11.84RR206 pKa = 11.84GARR209 pKa = 11.84TRR211 pKa = 3.3
Molecular weight: 20.73 kDa
Isoelectric point according different methods:
Peptides (in silico digests for buttom-up proteomics)
Below you can find in silico digests of the whole proteome with Trypsin, Chymotrypsin, Trypsin+LysC, LysN, ArgC proteases suitable for different mass spec machines.| Try ESI |
 |
|---|
| ChTry ESI |
 |
|---|
| ArgC ESI |
 |
|---|
| LysN ESI |
 |
|---|
| TryLysC ESI |
 |
|---|
| Try MALDI |
 |
|---|
| ChTry MALDI |
 |
|---|
| ArgC MALDI |
 |
|---|
| LysN MALDI |
 |
|---|
| TryLysC MALDI |
 |
|---|
| Try LTQ |
 |
|---|
| ChTry LTQ |
 |
|---|
| ArgC LTQ |
 |
|---|
| LysN LTQ |
 |
|---|
| TryLysC LTQ |
 |
|---|
| Try MSlow |
 |
|---|
| ChTry MSlow |
 |
|---|
| ArgC MSlow |
 |
|---|
| LysN MSlow |
 |
|---|
| TryLysC MSlow |
 |
|---|
| Try MShigh |
 |
|---|
| ChTry MShigh |
 |
|---|
| ArgC MShigh |
 |
|---|
| LysN MShigh |
 |
|---|
| TryLysC MShigh |
 |
|---|
General Statistics
Number of major isoforms |
Number of additional isoforms |
Number of all proteins |
Number of amino acids |
Min. Seq. Length |
Max. Seq. Length |
Avg. Seq. Length |
Avg. Mol. Weight |
|---|---|---|---|---|---|---|---|
0 |
1872375 |
26 |
16823 |
330.6 |
35.45 |
Amino acid frequency
Ala |
Cys |
Asp |
Glu |
Phe |
Gly |
His |
Ile |
Lys |
Leu |
|---|---|---|---|---|---|---|---|---|---|
13.607 ± 0.046 | 0.755 ± 0.012 |
6.198 ± 0.026 | 5.144 ± 0.032 |
2.613 ± 0.02 | 9.12 ± 0.031 |
2.259 ± 0.017 | 3.251 ± 0.025 |
1.559 ± 0.024 | 10.425 ± 0.045 |
Met |
Asn |
Gln |
Pro |
Arg |
Ser |
Thr |
Val |
Trp |
Tyr |
|---|---|---|---|---|---|---|---|---|---|
1.639 ± 0.013 | 1.763 ± 0.018 |
6.366 ± 0.037 | 2.852 ± 0.017 |
8.643 ± 0.039 | 4.808 ± 0.025 |
6.296 ± 0.029 | 9.088 ± 0.037 |
1.578 ± 0.014 | 2.038 ± 0.017 |
Most of the basic statistics you can see at this page can be downloaded from this CSV file
Proteome-pI is available under Creative Commons Attribution-NoDerivs license, for more details see here
| Reference: Kozlowski LP. Proteome-pI 2.0: Proteome Isoelectric Point Database Update. Nucleic Acids Res. 2021, doi: 10.1093/nar/gkab944 | Contact: Lukasz P. Kozlowski |
