Phytophthora kernoviae
Taxonomy: cellular organisms; Eukaryota; Sar; Stramenopiles; Oomycota; Peronosporales; Peronosporaceae; Phytophthora
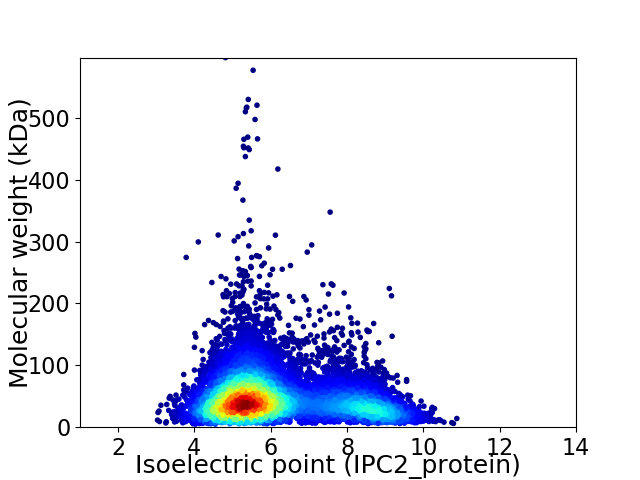
Average proteome isoelectric point is 6.14
Get precalculated fractions of proteins

Virtual 2D-PAGE plot for 9833 proteins (isoelectric point calculated using IPC2_protein)
Get csv file with sequences according to given criteria:
* You can choose from 21 different methods for calculating isoelectric point
Summary statistics related to proteome-wise predictions


Protein with the lowest isoelectric point:
>tr|A0A421ETC8|A0A421ETC8_9STRA CULLIN_2 domain-containing protein OS=Phytophthora kernoviae OX=325452 GN=BBI17_004979 PE=3 SV=1
MM1 pKa = 7.18HH2 pKa = 6.79TTFSLALVAAAVVLVDD18 pKa = 4.85AKK20 pKa = 8.71PTYY23 pKa = 9.44VARR26 pKa = 11.84IPNGANVPDD35 pKa = 4.21VAALGHH41 pKa = 6.17VDD43 pKa = 3.63PAGGGANNDD52 pKa = 3.26FGLDD56 pKa = 3.61FEE58 pKa = 5.08SAGEE62 pKa = 4.01SWTTEE67 pKa = 4.0FCQKK71 pKa = 10.97DD72 pKa = 3.47SDD74 pKa = 5.26GDD76 pKa = 3.91GQTNGQEE83 pKa = 4.74LGDD86 pKa = 4.45PCCQWVQDD94 pKa = 4.14SNAVLEE100 pKa = 4.4WTTGVSHH107 pKa = 7.42PGDD110 pKa = 3.31ASKK113 pKa = 9.84TSDD116 pKa = 3.15EE117 pKa = 4.57SLWASITCGSSNSTTASSTAGSSSSTGTTDD147 pKa = 3.43AGTPTTTDD155 pKa = 2.6TDD157 pKa = 3.67ATTSSSGGATASSSSAASAVTPGVYY182 pKa = 9.99SAVGVVAVVATFFLL196 pKa = 4.51
MM1 pKa = 7.18HH2 pKa = 6.79TTFSLALVAAAVVLVDD18 pKa = 4.85AKK20 pKa = 8.71PTYY23 pKa = 9.44VARR26 pKa = 11.84IPNGANVPDD35 pKa = 4.21VAALGHH41 pKa = 6.17VDD43 pKa = 3.63PAGGGANNDD52 pKa = 3.26FGLDD56 pKa = 3.61FEE58 pKa = 5.08SAGEE62 pKa = 4.01SWTTEE67 pKa = 4.0FCQKK71 pKa = 10.97DD72 pKa = 3.47SDD74 pKa = 5.26GDD76 pKa = 3.91GQTNGQEE83 pKa = 4.74LGDD86 pKa = 4.45PCCQWVQDD94 pKa = 4.14SNAVLEE100 pKa = 4.4WTTGVSHH107 pKa = 7.42PGDD110 pKa = 3.31ASKK113 pKa = 9.84TSDD116 pKa = 3.15EE117 pKa = 4.57SLWASITCGSSNSTTASSTAGSSSSTGTTDD147 pKa = 3.43AGTPTTTDD155 pKa = 2.6TDD157 pKa = 3.67ATTSSSGGATASSSSAASAVTPGVYY182 pKa = 9.99SAVGVVAVVATFFLL196 pKa = 4.51
Molecular weight: 19.4 kDa
Isoelectric point according different methods:
Protein with the highest isoelectric point:
>tr|A0A3R7JS05|A0A3R7JS05_9STRA Uncharacterized protein OS=Phytophthora kernoviae OX=325452 GN=BBI17_004821 PE=4 SV=1
MM1 pKa = 7.62ALFRR5 pKa = 11.84SLTRR9 pKa = 11.84QFKK12 pKa = 9.74ALSVAAPRR20 pKa = 11.84VAAQAPRR27 pKa = 11.84FAAVASVPSTTPASLVTTLALRR49 pKa = 11.84SAINFPQLQTRR60 pKa = 11.84SMGYY64 pKa = 9.78KK65 pKa = 10.2LKK67 pKa = 10.17TKK69 pKa = 10.65ASVKK73 pKa = 10.09KK74 pKa = 10.36RR75 pKa = 11.84FRR77 pKa = 11.84VNCNGVVKK85 pKa = 10.65RR86 pKa = 11.84SQANKK91 pKa = 9.53RR92 pKa = 11.84HH93 pKa = 5.93IATKK97 pKa = 8.75KK98 pKa = 7.02TRR100 pKa = 11.84EE101 pKa = 3.84RR102 pKa = 11.84IRR104 pKa = 11.84RR105 pKa = 11.84LGKK108 pKa = 9.37PVFVQGKK115 pKa = 7.01IRR117 pKa = 11.84KK118 pKa = 9.17NILRR122 pKa = 11.84MLAKK126 pKa = 10.4
MM1 pKa = 7.62ALFRR5 pKa = 11.84SLTRR9 pKa = 11.84QFKK12 pKa = 9.74ALSVAAPRR20 pKa = 11.84VAAQAPRR27 pKa = 11.84FAAVASVPSTTPASLVTTLALRR49 pKa = 11.84SAINFPQLQTRR60 pKa = 11.84SMGYY64 pKa = 9.78KK65 pKa = 10.2LKK67 pKa = 10.17TKK69 pKa = 10.65ASVKK73 pKa = 10.09KK74 pKa = 10.36RR75 pKa = 11.84FRR77 pKa = 11.84VNCNGVVKK85 pKa = 10.65RR86 pKa = 11.84SQANKK91 pKa = 9.53RR92 pKa = 11.84HH93 pKa = 5.93IATKK97 pKa = 8.75KK98 pKa = 7.02TRR100 pKa = 11.84EE101 pKa = 3.84RR102 pKa = 11.84IRR104 pKa = 11.84RR105 pKa = 11.84LGKK108 pKa = 9.37PVFVQGKK115 pKa = 7.01IRR117 pKa = 11.84KK118 pKa = 9.17NILRR122 pKa = 11.84MLAKK126 pKa = 10.4
Molecular weight: 14.07 kDa
Isoelectric point according different methods:
Peptides (in silico digests for buttom-up proteomics)
Below you can find in silico digests of the whole proteome with Trypsin, Chymotrypsin, Trypsin+LysC, LysN, ArgC proteases suitable for different mass spec machines.| Try ESI |
 |
|---|
| ChTry ESI |
 |
|---|
| ArgC ESI |
 |
|---|
| LysN ESI |
 |
|---|
| TryLysC ESI |
 |
|---|
| Try MALDI |
 |
|---|
| ChTry MALDI |
 |
|---|
| ArgC MALDI |
 |
|---|
| LysN MALDI |
 |
|---|
| TryLysC MALDI |
 |
|---|
| Try LTQ |
 |
|---|
| ChTry LTQ |
 |
|---|
| ArgC LTQ |
 |
|---|
| LysN LTQ |
 |
|---|
| TryLysC LTQ |
 |
|---|
| Try MSlow |
 |
|---|
| ChTry MSlow |
 |
|---|
| ArgC MSlow |
 |
|---|
| LysN MSlow |
 |
|---|
| TryLysC MSlow |
 |
|---|
| Try MShigh |
 |
|---|
| ChTry MShigh |
 |
|---|
| ArgC MShigh |
 |
|---|
| LysN MShigh |
 |
|---|
| TryLysC MShigh |
 |
|---|
General Statistics
Number of major isoforms |
Number of additional isoforms |
Number of all proteins |
Number of amino acids |
Min. Seq. Length |
Max. Seq. Length |
Avg. Seq. Length |
Avg. Mol. Weight |
|---|---|---|---|---|---|---|---|
0 |
4605710 |
49 |
5336 |
468.4 |
52.04 |
Amino acid frequency
Ala |
Cys |
Asp |
Glu |
Phe |
Gly |
His |
Ile |
Lys |
Leu |
|---|---|---|---|---|---|---|---|---|---|
8.715 ± 0.026 | 1.527 ± 0.011 |
5.806 ± 0.016 | 6.868 ± 0.03 |
3.969 ± 0.016 | 6.331 ± 0.024 |
2.29 ± 0.012 | 4.44 ± 0.016 |
5.379 ± 0.026 | 9.455 ± 0.027 |
Met |
Asn |
Gln |
Pro |
Arg |
Ser |
Thr |
Val |
Trp |
Tyr |
|---|---|---|---|---|---|---|---|---|---|
2.654 ± 0.01 | 3.729 ± 0.012 |
4.382 ± 0.016 | 4.17 ± 0.017 |
5.594 ± 0.019 | 7.612 ± 0.026 |
5.838 ± 0.02 | 7.301 ± 0.019 |
1.161 ± 0.008 | 2.779 ± 0.014 |
Most of the basic statistics you can see at this page can be downloaded from this CSV file
Proteome-pI is available under Creative Commons Attribution-NoDerivs license, for more details see here
| Reference: Kozlowski LP. Proteome-pI 2.0: Proteome Isoelectric Point Database Update. Nucleic Acids Res. 2021, doi: 10.1093/nar/gkab944 | Contact: Lukasz P. Kozlowski |
