Pasteurella phage Pm86
Taxonomy: Viruses; Duplodnaviria; Heunggongvirae; Uroviricota; Caudoviricetes; Caudovirales; Siphoviridae; unclassified Siphoviridae
Average proteome isoelectric point is 6.56
Get precalculated fractions of proteins

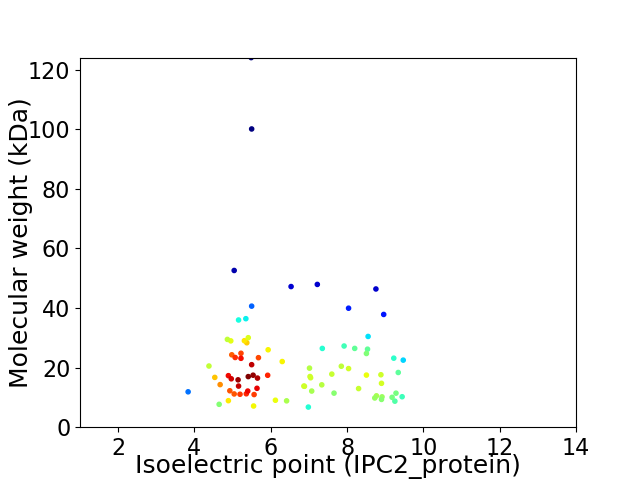
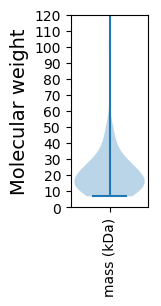
Virtual 2D-PAGE plot for 81 proteins (isoelectric point calculated using IPC2_protein)
Get csv file with sequences according to given criteria:
* You can choose from 21 different methods for calculating isoelectric point
Summary statistics related to proteome-wise predictions


Protein with the lowest isoelectric point:
>tr|A0A2Z4PZT5|A0A2Z4PZT5_9CAUD DNA methyltransferase OS=Pasteurella phage Pm86 OX=2201742 PE=4 SV=1
MM1 pKa = 6.93TQLTANQEE9 pKa = 3.83KK10 pKa = 10.48AIRR13 pKa = 11.84AFKK16 pKa = 10.58FSFTNQGVFNVDD28 pKa = 2.91QLVAYY33 pKa = 9.26FEE35 pKa = 5.15AEE37 pKa = 4.02GDD39 pKa = 3.73DD40 pKa = 4.2TEE42 pKa = 4.68TKK44 pKa = 10.29TFLATAYY51 pKa = 9.53ALNGAYY57 pKa = 9.88EE58 pKa = 4.12SGYY61 pKa = 10.68FDD63 pKa = 4.05IDD65 pKa = 3.3NAEE68 pKa = 4.22AQLEE72 pKa = 4.13ALNGYY77 pKa = 9.12GVDD80 pKa = 4.91GFDD83 pKa = 3.68FDD85 pKa = 5.5KK86 pKa = 11.24ALEE89 pKa = 4.22LCEE92 pKa = 4.41VFFDD96 pKa = 4.35LVEE99 pKa = 4.53KK100 pKa = 10.68GLYY103 pKa = 8.91EE104 pKa = 4.3VEE106 pKa = 4.1
MM1 pKa = 6.93TQLTANQEE9 pKa = 3.83KK10 pKa = 10.48AIRR13 pKa = 11.84AFKK16 pKa = 10.58FSFTNQGVFNVDD28 pKa = 2.91QLVAYY33 pKa = 9.26FEE35 pKa = 5.15AEE37 pKa = 4.02GDD39 pKa = 3.73DD40 pKa = 4.2TEE42 pKa = 4.68TKK44 pKa = 10.29TFLATAYY51 pKa = 9.53ALNGAYY57 pKa = 9.88EE58 pKa = 4.12SGYY61 pKa = 10.68FDD63 pKa = 4.05IDD65 pKa = 3.3NAEE68 pKa = 4.22AQLEE72 pKa = 4.13ALNGYY77 pKa = 9.12GVDD80 pKa = 4.91GFDD83 pKa = 3.68FDD85 pKa = 5.5KK86 pKa = 11.24ALEE89 pKa = 4.22LCEE92 pKa = 4.41VFFDD96 pKa = 4.35LVEE99 pKa = 4.53KK100 pKa = 10.68GLYY103 pKa = 8.91EE104 pKa = 4.3VEE106 pKa = 4.1
Molecular weight: 11.87 kDa
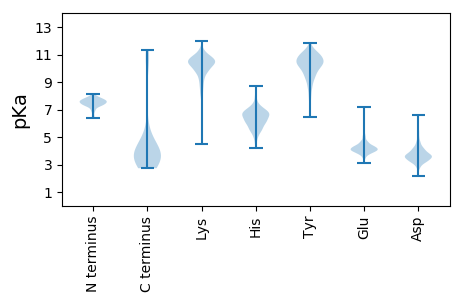
Isoelectric point according different methods:
Protein with the highest isoelectric point:
>tr|A0A2Z4Q085|A0A2Z4Q085_9CAUD Uncharacterized protein OS=Pasteurella phage Pm86 OX=2201742 PE=4 SV=1
MM1 pKa = 7.29VNVKK5 pKa = 10.03FYY7 pKa = 11.4GSLRR11 pKa = 11.84QFGTSFKK18 pKa = 10.94LDD20 pKa = 3.41AEE22 pKa = 4.29NTAEE26 pKa = 4.83IIRR29 pKa = 11.84ALTSQIPKK37 pKa = 9.89LRR39 pKa = 11.84EE40 pKa = 4.15FIQKK44 pKa = 10.32GYY46 pKa = 8.05FTVRR50 pKa = 11.84IAKK53 pKa = 9.72EE54 pKa = 4.1YY55 pKa = 10.0IDD57 pKa = 4.07NRR59 pKa = 11.84YY60 pKa = 9.44LEE62 pKa = 4.7KK63 pKa = 11.05GLFYY67 pKa = 10.85KK68 pKa = 10.58LKK70 pKa = 10.66EE71 pKa = 3.91GMTVHH76 pKa = 6.26FTPVLKK82 pKa = 10.41GSKK85 pKa = 9.71RR86 pKa = 11.84GGVFQTILGAALVGAAFLLGPVGFGLLSANSAWVVGGLGASLMLGGVAQLLTRR139 pKa = 11.84QPQMPAINEE148 pKa = 4.18KK149 pKa = 10.11EE150 pKa = 4.37KK151 pKa = 10.91KK152 pKa = 10.03QSTSFSNLSNMAAQGRR168 pKa = 11.84MVPLAYY174 pKa = 10.22GRR176 pKa = 11.84IRR178 pKa = 11.84CGSLVISQGVQTLDD192 pKa = 3.27VNIVEE197 pKa = 4.85KK198 pKa = 10.81NQNTGFSKK206 pKa = 10.96GG207 pKa = 3.38
MM1 pKa = 7.29VNVKK5 pKa = 10.03FYY7 pKa = 11.4GSLRR11 pKa = 11.84QFGTSFKK18 pKa = 10.94LDD20 pKa = 3.41AEE22 pKa = 4.29NTAEE26 pKa = 4.83IIRR29 pKa = 11.84ALTSQIPKK37 pKa = 9.89LRR39 pKa = 11.84EE40 pKa = 4.15FIQKK44 pKa = 10.32GYY46 pKa = 8.05FTVRR50 pKa = 11.84IAKK53 pKa = 9.72EE54 pKa = 4.1YY55 pKa = 10.0IDD57 pKa = 4.07NRR59 pKa = 11.84YY60 pKa = 9.44LEE62 pKa = 4.7KK63 pKa = 11.05GLFYY67 pKa = 10.85KK68 pKa = 10.58LKK70 pKa = 10.66EE71 pKa = 3.91GMTVHH76 pKa = 6.26FTPVLKK82 pKa = 10.41GSKK85 pKa = 9.71RR86 pKa = 11.84GGVFQTILGAALVGAAFLLGPVGFGLLSANSAWVVGGLGASLMLGGVAQLLTRR139 pKa = 11.84QPQMPAINEE148 pKa = 4.18KK149 pKa = 10.11EE150 pKa = 4.37KK151 pKa = 10.91KK152 pKa = 10.03QSTSFSNLSNMAAQGRR168 pKa = 11.84MVPLAYY174 pKa = 10.22GRR176 pKa = 11.84IRR178 pKa = 11.84CGSLVISQGVQTLDD192 pKa = 3.27VNIVEE197 pKa = 4.85KK198 pKa = 10.81NQNTGFSKK206 pKa = 10.96GG207 pKa = 3.38
Molecular weight: 22.5 kDa
Isoelectric point according different methods:
Peptides (in silico digests for buttom-up proteomics)
Below you can find in silico digests of the whole proteome with Trypsin, Chymotrypsin, Trypsin+LysC, LysN, ArgC proteases suitable for different mass spec machines.| Try ESI |
 |
|---|
| ChTry ESI |
 |
|---|
| ArgC ESI |
 |
|---|
| LysN ESI |
 |
|---|
| TryLysC ESI |
 |
|---|
| Try MALDI |
 |
|---|
| ChTry MALDI |
 |
|---|
| ArgC MALDI |
 |
|---|
| LysN MALDI |
 |
|---|
| TryLysC MALDI |
 |
|---|
| Try LTQ |
 |
|---|
| ChTry LTQ |
 |
|---|
| ArgC LTQ |
 |
|---|
| LysN LTQ |
 |
|---|
| TryLysC LTQ |
 |
|---|
| Try MSlow |
 |
|---|
| ChTry MSlow |
 |
|---|
| ArgC MSlow |
 |
|---|
| LysN MSlow |
 |
|---|
| TryLysC MSlow |
 |
|---|
| Try MShigh |
 |
|---|
| ChTry MShigh |
 |
|---|
| ArgC MShigh |
 |
|---|
| LysN MShigh |
 |
|---|
| TryLysC MShigh |
 |
|---|
General Statistics
Number of major isoforms |
Number of additional isoforms |
Number of all proteins |
Number of amino acids |
Min. Seq. Length |
Max. Seq. Length |
Avg. Seq. Length |
Avg. Mol. Weight |
|---|---|---|---|---|---|---|---|
0 |
16028 |
59 |
1113 |
197.9 |
22.38 |
Amino acid frequency
Ala |
Cys |
Asp |
Glu |
Phe |
Gly |
His |
Ile |
Lys |
Leu |
|---|---|---|---|---|---|---|---|---|---|
7.031 ± 0.297 | 1.254 ± 0.141 |
5.334 ± 0.176 | 7.861 ± 0.327 |
4.243 ± 0.169 | 6.301 ± 0.291 |
1.759 ± 0.14 | 7.138 ± 0.184 |
8.08 ± 0.288 | 8.398 ± 0.278 |
Met |
Asn |
Gln |
Pro |
Arg |
Ser |
Thr |
Val |
Trp |
Tyr |
|---|---|---|---|---|---|---|---|---|---|
2.234 ± 0.111 | 5.334 ± 0.168 |
3.219 ± 0.168 | 4.143 ± 0.2 |
4.767 ± 0.198 | 6.744 ± 0.248 |
5.291 ± 0.283 | 6.133 ± 0.208 |
1.341 ± 0.087 | 3.394 ± 0.157 |
Most of the basic statistics you can see at this page can be downloaded from this CSV file
Proteome-pI is available under Creative Commons Attribution-NoDerivs license, for more details see here
| Reference: Kozlowski LP. Proteome-pI 2.0: Proteome Isoelectric Point Database Update. Nucleic Acids Res. 2021, doi: 10.1093/nar/gkab944 | Contact: Lukasz P. Kozlowski |
