Marinomonas aquimarina
Taxonomy: cellular organisms; Bacteria; Proteobacteria; Gammaproteobacteria; Oceanospirillales; Oceanospirillaceae; Marinomonas
Average proteome isoelectric point is 5.92
Get precalculated fractions of proteins

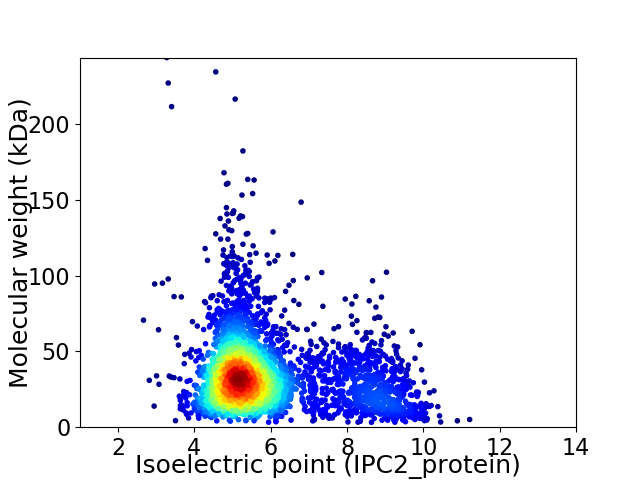
Virtual 2D-PAGE plot for 3360 proteins (isoelectric point calculated using IPC2_protein)
Get csv file with sequences according to given criteria:
* You can choose from 21 different methods for calculating isoelectric point
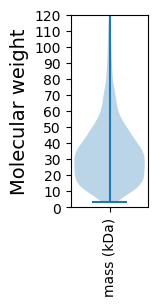
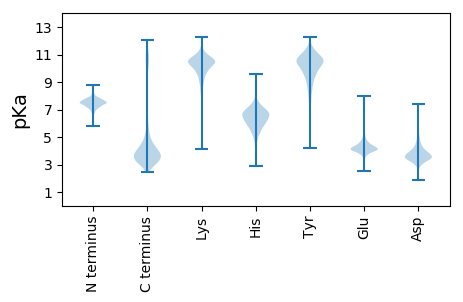
Summary statistics related to proteome-wise predictions


Protein with the lowest isoelectric point:
>tr|A0A1A8T2B5|A0A1A8T2B5_9GAMM Cytidylate kinase OS=Marinomonas aquimarina OX=295068 GN=cmk PE=3 SV=1
MM1 pKa = 7.31ITTSYY6 pKa = 10.28YY7 pKa = 9.92SSSRR11 pKa = 11.84YY12 pKa = 8.02STSNNGYY19 pKa = 10.21DD20 pKa = 3.51GVVRR24 pKa = 11.84IASNGSVGTGALLYY38 pKa = 10.49DD39 pKa = 3.94GRR41 pKa = 11.84AVLTAAHH48 pKa = 6.85LLDD51 pKa = 4.28GVSSAEE57 pKa = 3.82VTFLINGVKK66 pKa = 9.33TRR68 pKa = 11.84VSSSDD73 pKa = 3.63YY74 pKa = 10.61LLHH77 pKa = 7.09PSADD81 pKa = 3.26TTAANNDD88 pKa = 3.99LAILWLDD95 pKa = 3.43STPITAEE102 pKa = 3.73RR103 pKa = 11.84YY104 pKa = 9.06QIYY107 pKa = 9.92RR108 pKa = 11.84DD109 pKa = 3.46SDD111 pKa = 3.86EE112 pKa = 4.43IGQTFTMAGFGQYY125 pKa = 11.0GEE127 pKa = 4.64GASATRR133 pKa = 11.84YY134 pKa = 9.75NGSDD138 pKa = 3.04SVRR141 pKa = 11.84YY142 pKa = 9.04KK143 pKa = 10.72AQNTFDD149 pKa = 3.52VTGDD153 pKa = 3.49EE154 pKa = 4.81FKK156 pKa = 10.89QGLGSEE162 pKa = 4.58ISWTPASGTQLLADD176 pKa = 4.9FDD178 pKa = 4.39NGSAANDD185 pKa = 3.63AFGMLLGVNDD195 pKa = 4.97LGLGADD201 pKa = 4.25EE202 pKa = 5.12GLIAPGDD209 pKa = 3.85SGGSAFIDD217 pKa = 4.09GVIAGVASYY226 pKa = 8.2TASVSTWWADD236 pKa = 3.13TDD238 pKa = 3.46IDD240 pKa = 4.23EE241 pKa = 4.62VTNSSFGEE249 pKa = 3.72LAAWQRR255 pKa = 11.84VSHH258 pKa = 4.69YY259 pKa = 9.7QRR261 pKa = 11.84WIDD264 pKa = 3.45QSVRR268 pKa = 11.84EE269 pKa = 4.83HH270 pKa = 6.73YY271 pKa = 10.64DD272 pKa = 3.25SAPEE276 pKa = 4.08SPAEE280 pKa = 4.0VQLEE284 pKa = 4.36VVEE287 pKa = 4.65GDD289 pKa = 3.41SGSSYY294 pKa = 11.21AYY296 pKa = 10.71FMVSFNGDD304 pKa = 2.48RR305 pKa = 11.84GMADD309 pKa = 4.36DD310 pKa = 5.82IISVDD315 pKa = 3.4YY316 pKa = 7.95QTRR319 pKa = 11.84DD320 pKa = 3.0GSATAGEE327 pKa = 5.01DD328 pKa = 3.58YY329 pKa = 10.95LALSGTLNIYY339 pKa = 10.76DD340 pKa = 4.26DD341 pKa = 3.83EE342 pKa = 6.1SYY344 pKa = 11.82ALIAVEE350 pKa = 4.03VLGDD354 pKa = 3.46QTVEE358 pKa = 4.06DD359 pKa = 5.0DD360 pKa = 3.51EE361 pKa = 5.9AFYY364 pKa = 11.43LDD366 pKa = 3.35ITNPLGGSFGDD377 pKa = 3.86GVVTLTAMRR386 pKa = 11.84TILNDD391 pKa = 3.67DD392 pKa = 4.97LII394 pKa = 6.26
MM1 pKa = 7.31ITTSYY6 pKa = 10.28YY7 pKa = 9.92SSSRR11 pKa = 11.84YY12 pKa = 8.02STSNNGYY19 pKa = 10.21DD20 pKa = 3.51GVVRR24 pKa = 11.84IASNGSVGTGALLYY38 pKa = 10.49DD39 pKa = 3.94GRR41 pKa = 11.84AVLTAAHH48 pKa = 6.85LLDD51 pKa = 4.28GVSSAEE57 pKa = 3.82VTFLINGVKK66 pKa = 9.33TRR68 pKa = 11.84VSSSDD73 pKa = 3.63YY74 pKa = 10.61LLHH77 pKa = 7.09PSADD81 pKa = 3.26TTAANNDD88 pKa = 3.99LAILWLDD95 pKa = 3.43STPITAEE102 pKa = 3.73RR103 pKa = 11.84YY104 pKa = 9.06QIYY107 pKa = 9.92RR108 pKa = 11.84DD109 pKa = 3.46SDD111 pKa = 3.86EE112 pKa = 4.43IGQTFTMAGFGQYY125 pKa = 11.0GEE127 pKa = 4.64GASATRR133 pKa = 11.84YY134 pKa = 9.75NGSDD138 pKa = 3.04SVRR141 pKa = 11.84YY142 pKa = 9.04KK143 pKa = 10.72AQNTFDD149 pKa = 3.52VTGDD153 pKa = 3.49EE154 pKa = 4.81FKK156 pKa = 10.89QGLGSEE162 pKa = 4.58ISWTPASGTQLLADD176 pKa = 4.9FDD178 pKa = 4.39NGSAANDD185 pKa = 3.63AFGMLLGVNDD195 pKa = 4.97LGLGADD201 pKa = 4.25EE202 pKa = 5.12GLIAPGDD209 pKa = 3.85SGGSAFIDD217 pKa = 4.09GVIAGVASYY226 pKa = 8.2TASVSTWWADD236 pKa = 3.13TDD238 pKa = 3.46IDD240 pKa = 4.23EE241 pKa = 4.62VTNSSFGEE249 pKa = 3.72LAAWQRR255 pKa = 11.84VSHH258 pKa = 4.69YY259 pKa = 9.7QRR261 pKa = 11.84WIDD264 pKa = 3.45QSVRR268 pKa = 11.84EE269 pKa = 4.83HH270 pKa = 6.73YY271 pKa = 10.64DD272 pKa = 3.25SAPEE276 pKa = 4.08SPAEE280 pKa = 4.0VQLEE284 pKa = 4.36VVEE287 pKa = 4.65GDD289 pKa = 3.41SGSSYY294 pKa = 11.21AYY296 pKa = 10.71FMVSFNGDD304 pKa = 2.48RR305 pKa = 11.84GMADD309 pKa = 4.36DD310 pKa = 5.82IISVDD315 pKa = 3.4YY316 pKa = 7.95QTRR319 pKa = 11.84DD320 pKa = 3.0GSATAGEE327 pKa = 5.01DD328 pKa = 3.58YY329 pKa = 10.95LALSGTLNIYY339 pKa = 10.76DD340 pKa = 4.26DD341 pKa = 3.83EE342 pKa = 6.1SYY344 pKa = 11.82ALIAVEE350 pKa = 4.03VLGDD354 pKa = 3.46QTVEE358 pKa = 4.06DD359 pKa = 5.0DD360 pKa = 3.51EE361 pKa = 5.9AFYY364 pKa = 11.43LDD366 pKa = 3.35ITNPLGGSFGDD377 pKa = 3.86GVVTLTAMRR386 pKa = 11.84TILNDD391 pKa = 3.67DD392 pKa = 4.97LII394 pKa = 6.26
Molecular weight: 41.95 kDa
Isoelectric point according different methods:
Protein with the highest isoelectric point:
>tr|A0A1A8TD91|A0A1A8TD91_9GAMM Catecholate siderophore receptor Fiu OS=Marinomonas aquimarina OX=295068 GN=fiu PE=3 SV=1
MM1 pKa = 7.45KK2 pKa = 9.51RR3 pKa = 11.84TFQPSVLKK11 pKa = 10.42RR12 pKa = 11.84KK13 pKa = 9.36RR14 pKa = 11.84SHH16 pKa = 6.15GFRR19 pKa = 11.84ARR21 pKa = 11.84MATKK25 pKa = 10.37NGRR28 pKa = 11.84KK29 pKa = 9.16VLAARR34 pKa = 11.84RR35 pKa = 11.84ARR37 pKa = 11.84GRR39 pKa = 11.84KK40 pKa = 8.97VLSAA44 pKa = 4.11
MM1 pKa = 7.45KK2 pKa = 9.51RR3 pKa = 11.84TFQPSVLKK11 pKa = 10.42RR12 pKa = 11.84KK13 pKa = 9.36RR14 pKa = 11.84SHH16 pKa = 6.15GFRR19 pKa = 11.84ARR21 pKa = 11.84MATKK25 pKa = 10.37NGRR28 pKa = 11.84KK29 pKa = 9.16VLAARR34 pKa = 11.84RR35 pKa = 11.84ARR37 pKa = 11.84GRR39 pKa = 11.84KK40 pKa = 8.97VLSAA44 pKa = 4.11
Molecular weight: 5.08 kDa
Isoelectric point according different methods:
Peptides (in silico digests for buttom-up proteomics)
Below you can find in silico digests of the whole proteome with Trypsin, Chymotrypsin, Trypsin+LysC, LysN, ArgC proteases suitable for different mass spec machines.| Try ESI |
 |
|---|
| ChTry ESI |
 |
|---|
| ArgC ESI |
 |
|---|
| LysN ESI |
 |
|---|
| TryLysC ESI |
 |
|---|
| Try MALDI |
 |
|---|
| ChTry MALDI |
 |
|---|
| ArgC MALDI |
 |
|---|
| LysN MALDI |
 |
|---|
| TryLysC MALDI |
 |
|---|
| Try LTQ |
 |
|---|
| ChTry LTQ |
 |
|---|
| ArgC LTQ |
 |
|---|
| LysN LTQ |
 |
|---|
| TryLysC LTQ |
 |
|---|
| Try MSlow |
 |
|---|
| ChTry MSlow |
 |
|---|
| ArgC MSlow |
 |
|---|
| LysN MSlow |
 |
|---|
| TryLysC MSlow |
 |
|---|
| Try MShigh |
 |
|---|
| ChTry MShigh |
 |
|---|
| ArgC MShigh |
 |
|---|
| LysN MShigh |
 |
|---|
| TryLysC MShigh |
 |
|---|
General Statistics
Number of major isoforms |
Number of additional isoforms |
Number of all proteins |
Number of amino acids |
Min. Seq. Length |
Max. Seq. Length |
Avg. Seq. Length |
Avg. Mol. Weight |
|---|---|---|---|---|---|---|---|
0 |
1092500 |
29 |
2315 |
325.1 |
36.02 |
Amino acid frequency
Ala |
Cys |
Asp |
Glu |
Phe |
Gly |
His |
Ile |
Lys |
Leu |
|---|---|---|---|---|---|---|---|---|---|
9.492 ± 0.048 | 0.981 ± 0.014 |
5.631 ± 0.041 | 6.431 ± 0.042 |
3.988 ± 0.026 | 6.861 ± 0.041 |
2.328 ± 0.024 | 5.823 ± 0.034 |
4.484 ± 0.034 | 10.734 ± 0.055 |
Met |
Asn |
Gln |
Pro |
Arg |
Ser |
Thr |
Val |
Trp |
Tyr |
|---|---|---|---|---|---|---|---|---|---|
2.669 ± 0.022 | 3.684 ± 0.033 |
4.048 ± 0.031 | 4.906 ± 0.038 |
4.927 ± 0.035 | 6.53 ± 0.038 |
5.169 ± 0.044 | 7.139 ± 0.031 |
1.286 ± 0.019 | 2.889 ± 0.023 |
Most of the basic statistics you can see at this page can be downloaded from this CSV file
Proteome-pI is available under Creative Commons Attribution-NoDerivs license, for more details see here
| Reference: Kozlowski LP. Proteome-pI 2.0: Proteome Isoelectric Point Database Update. Nucleic Acids Res. 2021, doi: 10.1093/nar/gkab944 | Contact: Lukasz P. Kozlowski |
