Nitrosomonas sp. AL212
Taxonomy: cellular organisms; Bacteria; Proteobacteria; Betaproteobacteria; Nitrosomonadales; Nitrosomonadaceae; Nitrosomonas; unclassified Nitrosomonas
Average proteome isoelectric point is 6.53
Get precalculated fractions of proteins

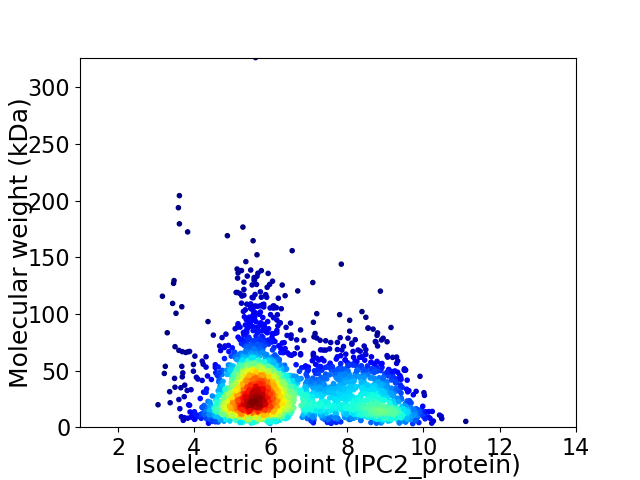
Virtual 2D-PAGE plot for 2841 proteins (isoelectric point calculated using IPC2_protein)
Get csv file with sequences according to given criteria:
* You can choose from 21 different methods for calculating isoelectric point
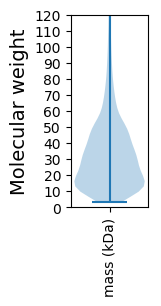
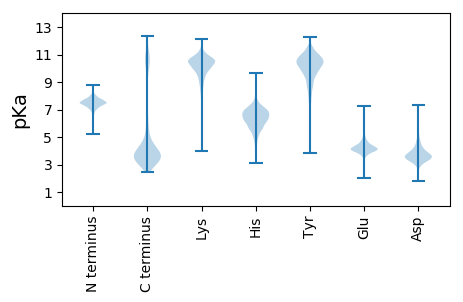
Summary statistics related to proteome-wise predictions


Protein with the lowest isoelectric point:
>tr|F9ZJ06|F9ZJ06_9PROT Flagellar transcriptional regulator FlhC OS=Nitrosomonas sp. AL212 OX=153948 GN=flhC PE=3 SV=1
MM1 pKa = 7.48SFHH4 pKa = 7.2LFHH7 pKa = 8.03INEE10 pKa = 4.22VFSNATGTVQFIEE23 pKa = 4.6FVGDD27 pKa = 3.55ANIQHH32 pKa = 6.53FWAGHH37 pKa = 5.37SIISTNDD44 pKa = 2.69ITSNTYY50 pKa = 10.87SFGTDD55 pKa = 3.15LPGSATAGKK64 pKa = 9.88AVLIATQGFADD75 pKa = 4.67LGIVAPDD82 pKa = 3.58YY83 pKa = 10.68IIPDD87 pKa = 3.61GFLFTTNGAINFPGMIGGTISYY109 pKa = 10.05VALPVDD115 pKa = 4.08GTTSLNRR122 pKa = 11.84DD123 pKa = 2.72GSTGVNSPTNFVGNTGTIFSNVISGTNGADD153 pKa = 3.34NLTGTPGADD162 pKa = 3.49IINAGDD168 pKa = 3.65GLDD171 pKa = 3.52RR172 pKa = 11.84LNGVGGNDD180 pKa = 3.44TLEE183 pKa = 4.62GGLGIDD189 pKa = 3.37TAIYY193 pKa = 8.99SGNRR197 pKa = 11.84VGYY200 pKa = 8.22TIATTSSGFNISGSEE215 pKa = 4.02GDD217 pKa = 4.01DD218 pKa = 3.27TLSGIEE224 pKa = 4.02RR225 pKa = 11.84LQFADD230 pKa = 3.59TKK232 pKa = 11.19LAMDD236 pKa = 5.15LNNGQAANNTARR248 pKa = 11.84IIGAAFGVPAITEE261 pKa = 4.02HH262 pKa = 7.08PDD264 pKa = 3.23YY265 pKa = 10.95VTIGLNLFDD274 pKa = 4.58SGQTVLEE281 pKa = 4.23VSEE284 pKa = 4.47LAVNVLDD291 pKa = 4.63LSNDD295 pKa = 3.45EE296 pKa = 4.86FVDD299 pKa = 3.73AVYY302 pKa = 10.94QNVVGAVPAPAVHH315 pKa = 6.97DD316 pKa = 4.15FYY318 pKa = 12.04VSLLQGSGGSSTQAQLMEE336 pKa = 4.82IGANSVEE343 pKa = 4.1NALNIDD349 pKa = 4.05LAGLAQNGVVFII361 pKa = 4.97
MM1 pKa = 7.48SFHH4 pKa = 7.2LFHH7 pKa = 8.03INEE10 pKa = 4.22VFSNATGTVQFIEE23 pKa = 4.6FVGDD27 pKa = 3.55ANIQHH32 pKa = 6.53FWAGHH37 pKa = 5.37SIISTNDD44 pKa = 2.69ITSNTYY50 pKa = 10.87SFGTDD55 pKa = 3.15LPGSATAGKK64 pKa = 9.88AVLIATQGFADD75 pKa = 4.67LGIVAPDD82 pKa = 3.58YY83 pKa = 10.68IIPDD87 pKa = 3.61GFLFTTNGAINFPGMIGGTISYY109 pKa = 10.05VALPVDD115 pKa = 4.08GTTSLNRR122 pKa = 11.84DD123 pKa = 2.72GSTGVNSPTNFVGNTGTIFSNVISGTNGADD153 pKa = 3.34NLTGTPGADD162 pKa = 3.49IINAGDD168 pKa = 3.65GLDD171 pKa = 3.52RR172 pKa = 11.84LNGVGGNDD180 pKa = 3.44TLEE183 pKa = 4.62GGLGIDD189 pKa = 3.37TAIYY193 pKa = 8.99SGNRR197 pKa = 11.84VGYY200 pKa = 8.22TIATTSSGFNISGSEE215 pKa = 4.02GDD217 pKa = 4.01DD218 pKa = 3.27TLSGIEE224 pKa = 4.02RR225 pKa = 11.84LQFADD230 pKa = 3.59TKK232 pKa = 11.19LAMDD236 pKa = 5.15LNNGQAANNTARR248 pKa = 11.84IIGAAFGVPAITEE261 pKa = 4.02HH262 pKa = 7.08PDD264 pKa = 3.23YY265 pKa = 10.95VTIGLNLFDD274 pKa = 4.58SGQTVLEE281 pKa = 4.23VSEE284 pKa = 4.47LAVNVLDD291 pKa = 4.63LSNDD295 pKa = 3.45EE296 pKa = 4.86FVDD299 pKa = 3.73AVYY302 pKa = 10.94QNVVGAVPAPAVHH315 pKa = 6.97DD316 pKa = 4.15FYY318 pKa = 12.04VSLLQGSGGSSTQAQLMEE336 pKa = 4.82IGANSVEE343 pKa = 4.1NALNIDD349 pKa = 4.05LAGLAQNGVVFII361 pKa = 4.97
Molecular weight: 37.12 kDa
Isoelectric point according different methods:
Protein with the highest isoelectric point:
>tr|F9ZIG7|F9ZIG7_9PROT Methylated-DNA--[protein]-cysteine S-methyltransferase OS=Nitrosomonas sp. AL212 OX=153948 GN=NAL212_2725 PE=4 SV=1
MM1 pKa = 7.35KK2 pKa = 9.36RR3 pKa = 11.84TYY5 pKa = 10.14QPSVTKK11 pKa = 10.56RR12 pKa = 11.84KK13 pKa = 7.91RR14 pKa = 11.84THH16 pKa = 5.86GFLVRR21 pKa = 11.84MRR23 pKa = 11.84TRR25 pKa = 11.84SGAAIIRR32 pKa = 11.84ARR34 pKa = 11.84RR35 pKa = 11.84AKK37 pKa = 10.04GRR39 pKa = 11.84ARR41 pKa = 11.84LSVV44 pKa = 3.12
MM1 pKa = 7.35KK2 pKa = 9.36RR3 pKa = 11.84TYY5 pKa = 10.14QPSVTKK11 pKa = 10.56RR12 pKa = 11.84KK13 pKa = 7.91RR14 pKa = 11.84THH16 pKa = 5.86GFLVRR21 pKa = 11.84MRR23 pKa = 11.84TRR25 pKa = 11.84SGAAIIRR32 pKa = 11.84ARR34 pKa = 11.84RR35 pKa = 11.84AKK37 pKa = 10.04GRR39 pKa = 11.84ARR41 pKa = 11.84LSVV44 pKa = 3.12
Molecular weight: 5.13 kDa
Isoelectric point according different methods:
Peptides (in silico digests for buttom-up proteomics)
Below you can find in silico digests of the whole proteome with Trypsin, Chymotrypsin, Trypsin+LysC, LysN, ArgC proteases suitable for different mass spec machines.| Try ESI |
 |
|---|
| ChTry ESI |
 |
|---|
| ArgC ESI |
 |
|---|
| LysN ESI |
 |
|---|
| TryLysC ESI |
 |
|---|
| Try MALDI |
 |
|---|
| ChTry MALDI |
 |
|---|
| ArgC MALDI |
 |
|---|
| LysN MALDI |
 |
|---|
| TryLysC MALDI |
 |
|---|
| Try LTQ |
 |
|---|
| ChTry LTQ |
 |
|---|
| ArgC LTQ |
 |
|---|
| LysN LTQ |
 |
|---|
| TryLysC LTQ |
 |
|---|
| Try MSlow |
 |
|---|
| ChTry MSlow |
 |
|---|
| ArgC MSlow |
 |
|---|
| LysN MSlow |
 |
|---|
| TryLysC MSlow |
 |
|---|
| Try MShigh |
 |
|---|
| ChTry MShigh |
 |
|---|
| ArgC MShigh |
 |
|---|
| LysN MShigh |
 |
|---|
| TryLysC MShigh |
 |
|---|
General Statistics
Number of major isoforms |
Number of additional isoforms |
Number of all proteins |
Number of amino acids |
Min. Seq. Length |
Max. Seq. Length |
Avg. Seq. Length |
Avg. Mol. Weight |
|---|---|---|---|---|---|---|---|
0 |
886936 |
27 |
2886 |
312.2 |
34.74 |
Amino acid frequency
Ala |
Cys |
Asp |
Glu |
Phe |
Gly |
His |
Ile |
Lys |
Leu |
|---|---|---|---|---|---|---|---|---|---|
8.7 ± 0.053 | 0.984 ± 0.017 |
5.344 ± 0.043 | 5.898 ± 0.047 |
4.101 ± 0.033 | 6.93 ± 0.068 |
2.464 ± 0.026 | 7.282 ± 0.043 |
4.941 ± 0.052 | 10.393 ± 0.057 |
Met |
Asn |
Gln |
Pro |
Arg |
Ser |
Thr |
Val |
Trp |
Tyr |
|---|---|---|---|---|---|---|---|---|---|
2.478 ± 0.024 | 4.417 ± 0.042 |
4.165 ± 0.03 | 4.353 ± 0.037 |
5.337 ± 0.043 | 6.266 ± 0.038 |
5.41 ± 0.042 | 6.389 ± 0.04 |
1.255 ± 0.017 | 2.894 ± 0.026 |
Most of the basic statistics you can see at this page can be downloaded from this CSV file
Proteome-pI is available under Creative Commons Attribution-NoDerivs license, for more details see here
| Reference: Kozlowski LP. Proteome-pI 2.0: Proteome Isoelectric Point Database Update. Nucleic Acids Res. 2021, doi: 10.1093/nar/gkab944 | Contact: Lukasz P. Kozlowski |
