Drosophila lebanonensis (Fruit fly) (Scaptodrosophila lebanonensis)
Taxonomy: cellular organisms; Eukaryota; Opisthokonta; Metazoa; Eumetazoa; Bilateria; Protostomia; Ecdysozoa; Panarthropoda; Arthropoda; Mandibulata; Pancrustacea; Hexapoda; Insecta; Dicondylia; Pterygota; Neoptera; Endopterygota; Diptera; Brachycera; Muscomorpha; Eremoneura;
Average proteome isoelectric point is 6.72
Get precalculated fractions of proteins

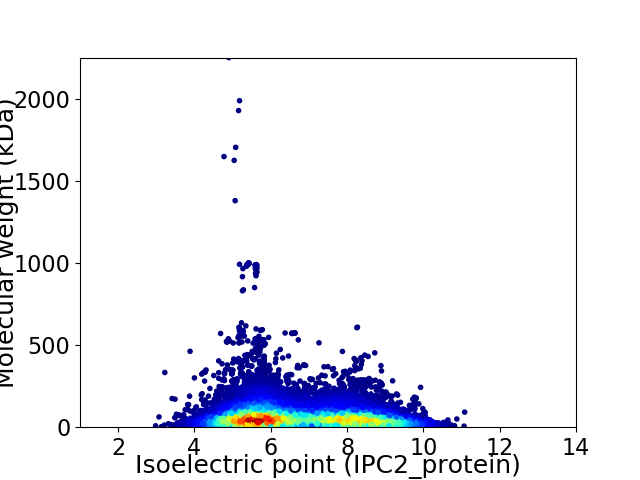
Virtual 2D-PAGE plot for 17832 proteins (isoelectric point calculated using IPC2_protein)
Get csv file with sequences according to given criteria:
* You can choose from 21 different methods for calculating isoelectric point
Summary statistics related to proteome-wise predictions


Protein with the lowest isoelectric point:
>tr|A0A6J2U9I6|A0A6J2U9I6_DROLE uncharacterized protein LOC115632138 isoform X1 OS=Drosophila lebanonensis OX=7225 GN=LOC115632138 PE=4 SV=1
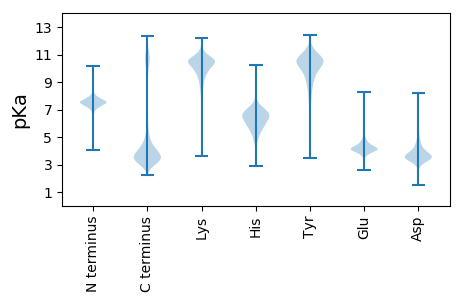
MM1 pKa = 7.6KK2 pKa = 10.54SIFLLLALLALTAICPANVLQCYY25 pKa = 9.04EE26 pKa = 4.89CIGDD30 pKa = 4.65DD31 pKa = 4.63CDD33 pKa = 5.62DD34 pKa = 4.49LNEE37 pKa = 4.28SLLVEE42 pKa = 4.2CSVDD46 pKa = 3.42NTPSTTEE53 pKa = 3.97SPASGTSSAVTDD65 pKa = 3.67HH66 pKa = 6.66TSVSSSDD73 pKa = 3.89DD74 pKa = 3.54DD75 pKa = 4.54RR76 pKa = 11.84SSTTTPTVTTDD87 pKa = 3.17GSSIGPGSSDD97 pKa = 3.29STSGSTEE104 pKa = 4.0TSSLTSTTDD113 pKa = 3.23DD114 pKa = 3.47SSISQDD120 pKa = 3.28STDD123 pKa = 3.6STEE126 pKa = 4.18SSPLTSTTDD135 pKa = 3.19EE136 pKa = 4.33SSISPGSSDD145 pKa = 3.37STSGSTEE152 pKa = 3.93TSPLTSTTDD161 pKa = 3.39DD162 pKa = 3.51SSISPGSTDD171 pKa = 2.81STTDD175 pKa = 2.93EE176 pKa = 4.45STVGSSSSPSSTEE189 pKa = 3.58SSTGSAEE196 pKa = 4.24SSSTAATTDD205 pKa = 3.05EE206 pKa = 4.51TTNEE210 pKa = 4.25SASSEE215 pKa = 4.03RR216 pKa = 11.84STDD219 pKa = 2.94ITSSPTTTEE228 pKa = 3.32ISSPSSTTVASTDD241 pKa = 3.35LSSTTEE247 pKa = 3.86ASSSRR252 pKa = 11.84STNVAATGSSTATTDD267 pKa = 3.36DD268 pKa = 3.72SSISSASTTTTEE280 pKa = 3.68PTEE283 pKa = 4.37AKK285 pKa = 10.33SSLLARR291 pKa = 11.84ASQQLIRR298 pKa = 11.84NYY300 pKa = 10.56RR301 pKa = 11.84SIEE304 pKa = 4.0RR305 pKa = 11.84YY306 pKa = 9.11GRR308 pKa = 11.84AASEE312 pKa = 4.08YY313 pKa = 10.24RR314 pKa = 11.84SAACYY319 pKa = 7.96TLNVGGVIHH328 pKa = 6.94RR329 pKa = 11.84GCVRR333 pKa = 11.84IPQDD337 pKa = 3.02WTSSVCAAVEE347 pKa = 3.91QQIDD351 pKa = 3.64VSDD354 pKa = 3.72NTDD357 pKa = 3.26TDD359 pKa = 3.68DD360 pKa = 4.23CTYY363 pKa = 11.37CLMDD367 pKa = 4.15RR368 pKa = 11.84CNSSASLRR376 pKa = 11.84VSLMAVLLICTLKK389 pKa = 11.07YY390 pKa = 10.82LFF392 pKa = 4.85
MM1 pKa = 7.6KK2 pKa = 10.54SIFLLLALLALTAICPANVLQCYY25 pKa = 9.04EE26 pKa = 4.89CIGDD30 pKa = 4.65DD31 pKa = 4.63CDD33 pKa = 5.62DD34 pKa = 4.49LNEE37 pKa = 4.28SLLVEE42 pKa = 4.2CSVDD46 pKa = 3.42NTPSTTEE53 pKa = 3.97SPASGTSSAVTDD65 pKa = 3.67HH66 pKa = 6.66TSVSSSDD73 pKa = 3.89DD74 pKa = 3.54DD75 pKa = 4.54RR76 pKa = 11.84SSTTTPTVTTDD87 pKa = 3.17GSSIGPGSSDD97 pKa = 3.29STSGSTEE104 pKa = 4.0TSSLTSTTDD113 pKa = 3.23DD114 pKa = 3.47SSISQDD120 pKa = 3.28STDD123 pKa = 3.6STEE126 pKa = 4.18SSPLTSTTDD135 pKa = 3.19EE136 pKa = 4.33SSISPGSSDD145 pKa = 3.37STSGSTEE152 pKa = 3.93TSPLTSTTDD161 pKa = 3.39DD162 pKa = 3.51SSISPGSTDD171 pKa = 2.81STTDD175 pKa = 2.93EE176 pKa = 4.45STVGSSSSPSSTEE189 pKa = 3.58SSTGSAEE196 pKa = 4.24SSSTAATTDD205 pKa = 3.05EE206 pKa = 4.51TTNEE210 pKa = 4.25SASSEE215 pKa = 4.03RR216 pKa = 11.84STDD219 pKa = 2.94ITSSPTTTEE228 pKa = 3.32ISSPSSTTVASTDD241 pKa = 3.35LSSTTEE247 pKa = 3.86ASSSRR252 pKa = 11.84STNVAATGSSTATTDD267 pKa = 3.36DD268 pKa = 3.72SSISSASTTTTEE280 pKa = 3.68PTEE283 pKa = 4.37AKK285 pKa = 10.33SSLLARR291 pKa = 11.84ASQQLIRR298 pKa = 11.84NYY300 pKa = 10.56RR301 pKa = 11.84SIEE304 pKa = 4.0RR305 pKa = 11.84YY306 pKa = 9.11GRR308 pKa = 11.84AASEE312 pKa = 4.08YY313 pKa = 10.24RR314 pKa = 11.84SAACYY319 pKa = 7.96TLNVGGVIHH328 pKa = 6.94RR329 pKa = 11.84GCVRR333 pKa = 11.84IPQDD337 pKa = 3.02WTSSVCAAVEE347 pKa = 3.91QQIDD351 pKa = 3.64VSDD354 pKa = 3.72NTDD357 pKa = 3.26TDD359 pKa = 3.68DD360 pKa = 4.23CTYY363 pKa = 11.37CLMDD367 pKa = 4.15RR368 pKa = 11.84CNSSASLRR376 pKa = 11.84VSLMAVLLICTLKK389 pKa = 11.07YY390 pKa = 10.82LFF392 pKa = 4.85
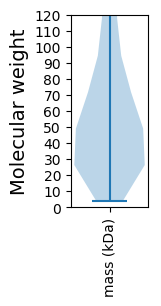
Molecular weight: 40.13 kDa
Isoelectric point according different methods:
Protein with the highest isoelectric point:
>tr|A0A6J2UF48|A0A6J2UF48_DROLE DET1 homolog isoform X1 OS=Drosophila lebanonensis OX=7225 GN=LOC115633708 PE=4 SV=1
MM1 pKa = 7.62AAHH4 pKa = 6.95KK5 pKa = 10.42SFRR8 pKa = 11.84IKK10 pKa = 10.51QKK12 pKa = 10.12LAKK15 pKa = 9.77KK16 pKa = 9.79LKK18 pKa = 9.05QNRR21 pKa = 11.84SVPQWVRR28 pKa = 11.84LRR30 pKa = 11.84TGNTIRR36 pKa = 11.84YY37 pKa = 5.79NAKK40 pKa = 8.47RR41 pKa = 11.84RR42 pKa = 11.84HH43 pKa = 4.1WRR45 pKa = 11.84RR46 pKa = 11.84TKK48 pKa = 10.89LKK50 pKa = 10.55LL51 pKa = 3.39
MM1 pKa = 7.62AAHH4 pKa = 6.95KK5 pKa = 10.42SFRR8 pKa = 11.84IKK10 pKa = 10.51QKK12 pKa = 10.12LAKK15 pKa = 9.77KK16 pKa = 9.79LKK18 pKa = 9.05QNRR21 pKa = 11.84SVPQWVRR28 pKa = 11.84LRR30 pKa = 11.84TGNTIRR36 pKa = 11.84YY37 pKa = 5.79NAKK40 pKa = 8.47RR41 pKa = 11.84RR42 pKa = 11.84HH43 pKa = 4.1WRR45 pKa = 11.84RR46 pKa = 11.84TKK48 pKa = 10.89LKK50 pKa = 10.55LL51 pKa = 3.39
Molecular weight: 6.3 kDa
Isoelectric point according different methods:
Peptides (in silico digests for buttom-up proteomics)
Below you can find in silico digests of the whole proteome with Trypsin, Chymotrypsin, Trypsin+LysC, LysN, ArgC proteases suitable for different mass spec machines.| Try ESI |
 |
|---|
| ChTry ESI |
 |
|---|
| ArgC ESI |
 |
|---|
| LysN ESI |
 |
|---|
| TryLysC ESI |
 |
|---|
| Try MALDI |
 |
|---|
| ChTry MALDI |
 |
|---|
| ArgC MALDI |
 |
|---|
| LysN MALDI |
 |
|---|
| TryLysC MALDI |
 |
|---|
| Try LTQ |
 |
|---|
| ChTry LTQ |
 |
|---|
| ArgC LTQ |
 |
|---|
| LysN LTQ |
 |
|---|
| TryLysC LTQ |
 |
|---|
| Try MSlow |
 |
|---|
| ChTry MSlow |
 |
|---|
| ArgC MSlow |
 |
|---|
| LysN MSlow |
 |
|---|
| TryLysC MSlow |
 |
|---|
| Try MShigh |
 |
|---|
| ChTry MShigh |
 |
|---|
| ArgC MShigh |
 |
|---|
| LysN MShigh |
 |
|---|
| TryLysC MShigh |
 |
|---|
General Statistics
Number of major isoforms |
Number of additional isoforms |
Number of all proteins |
Number of amino acids |
Min. Seq. Length |
Max. Seq. Length |
Avg. Seq. Length |
Avg. Mol. Weight |
|---|---|---|---|---|---|---|---|
11910080 |
31 |
19754 |
667.9 |
74.48 |
Amino acid frequency
Ala |
Cys |
Asp |
Glu |
Phe |
Gly |
His |
Ile |
Lys |
Leu |
|---|---|---|---|---|---|---|---|---|---|
7.642 ± 0.028 | 1.824 ± 0.031 |
5.238 ± 0.019 | 6.459 ± 0.031 |
3.335 ± 0.017 | 5.752 ± 0.022 |
2.629 ± 0.01 | 4.995 ± 0.016 |
5.703 ± 0.027 | 8.948 ± 0.034 |
Met |
Asn |
Gln |
Pro |
Arg |
Ser |
Thr |
Val |
Trp |
Tyr |
|---|---|---|---|---|---|---|---|---|---|
2.274 ± 0.011 | 5.081 ± 0.017 |
5.368 ± 0.03 | 5.41 ± 0.028 |
5.413 ± 0.017 | 8.211 ± 0.028 |
6.105 ± 0.018 | 5.748 ± 0.017 |
0.947 ± 0.007 | 2.915 ± 0.012 |
Most of the basic statistics you can see at this page can be downloaded from this CSV file
Proteome-pI is available under Creative Commons Attribution-NoDerivs license, for more details see here
| Reference: Kozlowski LP. Proteome-pI 2.0: Proteome Isoelectric Point Database Update. Nucleic Acids Res. 2021, doi: 10.1093/nar/gkab944 | Contact: Lukasz P. Kozlowski |
