Olsenella profusa F0195
Taxonomy: cellular organisms; Bacteria; Terrabacteria group; Actinobacteria; Coriobacteriia; Coriobacteriales; Atopobiaceae; Olsenella; Olsenella profusa
Average proteome isoelectric point is 6.01
Get precalculated fractions of proteins

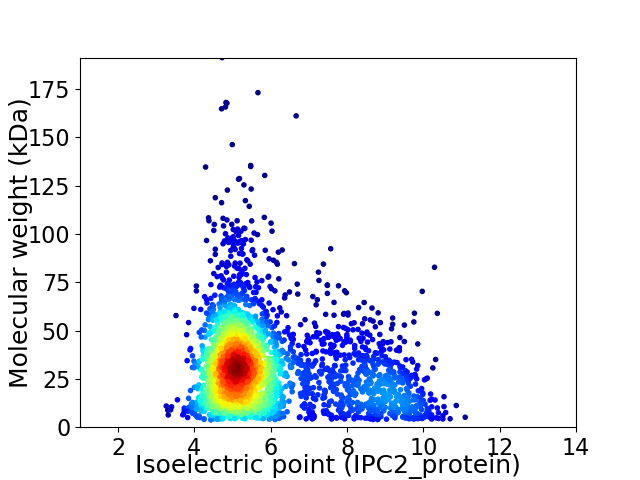
Virtual 2D-PAGE plot for 2650 proteins (isoelectric point calculated using IPC2_protein)
Get csv file with sequences according to given criteria:
* You can choose from 21 different methods for calculating isoelectric point
Summary statistics related to proteome-wise predictions


Protein with the lowest isoelectric point:
>tr|U2TT32|U2TT32_9ACTN ABC transporter transmembrane region domain protein OS=Olsenella profusa F0195 OX=1125712 GN=HMPREF1316_1668 PE=4 SV=1
MM1 pKa = 7.69PWPEE5 pKa = 3.71RR6 pKa = 11.84ALVFLVTLVLALGVGAGVRR25 pKa = 11.84RR26 pKa = 11.84CLAQPTDD33 pKa = 3.74YY34 pKa = 10.81GPDD37 pKa = 3.33VITPTDD43 pKa = 3.53SVTDD47 pKa = 3.77GTAPDD52 pKa = 3.97DD53 pKa = 3.64QGAATDD59 pKa = 3.88AASNAPTSLTAEE71 pKa = 4.4ADD73 pKa = 3.21GGALVLSGDD82 pKa = 3.61VGSRR86 pKa = 11.84TVDD89 pKa = 3.34DD90 pKa = 4.75LSAVVQEE97 pKa = 5.2LDD99 pKa = 3.15ALQDD103 pKa = 3.36GGIQAGVAVTSLDD116 pKa = 3.32GSITLTYY123 pKa = 10.5QQDD126 pKa = 3.32QSFYY130 pKa = 10.35AASTIKK136 pKa = 10.6APYY139 pKa = 7.69VCAVLEE145 pKa = 4.15EE146 pKa = 4.7DD147 pKa = 4.67LPAGTTSMASLRR159 pKa = 11.84DD160 pKa = 3.64AMSSMLLYY168 pKa = 10.52SDD170 pKa = 3.66NDD172 pKa = 3.39SYY174 pKa = 11.69RR175 pKa = 11.84QLRR178 pKa = 11.84DD179 pKa = 3.07SYY181 pKa = 11.59GDD183 pKa = 3.77DD184 pKa = 4.59VFLTWLQRR192 pKa = 11.84HH193 pKa = 6.15DD194 pKa = 4.01VTAGTYY200 pKa = 10.71GSLSDD205 pKa = 4.12YY206 pKa = 11.36ARR208 pKa = 11.84DD209 pKa = 3.79HH210 pKa = 6.77YY211 pKa = 11.07PFSTPEE217 pKa = 3.76QLTQMWQAVWAFVSGDD233 pKa = 3.61AQGASYY239 pKa = 10.96LKK241 pKa = 10.6DD242 pKa = 3.08LLARR246 pKa = 11.84RR247 pKa = 11.84EE248 pKa = 3.96EE249 pKa = 4.3SPIANALGPQTEE261 pKa = 4.9TYY263 pKa = 10.67SKK265 pKa = 10.77AGWYY269 pKa = 9.61PEE271 pKa = 4.13TDD273 pKa = 3.56GSDD276 pKa = 3.21AAPASNDD283 pKa = 3.19AGVVIHH289 pKa = 6.69GSASTSYY296 pKa = 10.14VISVMSTAPSEE307 pKa = 4.08LDD309 pKa = 3.16RR310 pKa = 11.84LEE312 pKa = 4.36GLISAIDD319 pKa = 3.75HH320 pKa = 6.83LMDD323 pKa = 5.46ADD325 pKa = 4.15GAA327 pKa = 4.23
MM1 pKa = 7.69PWPEE5 pKa = 3.71RR6 pKa = 11.84ALVFLVTLVLALGVGAGVRR25 pKa = 11.84RR26 pKa = 11.84CLAQPTDD33 pKa = 3.74YY34 pKa = 10.81GPDD37 pKa = 3.33VITPTDD43 pKa = 3.53SVTDD47 pKa = 3.77GTAPDD52 pKa = 3.97DD53 pKa = 3.64QGAATDD59 pKa = 3.88AASNAPTSLTAEE71 pKa = 4.4ADD73 pKa = 3.21GGALVLSGDD82 pKa = 3.61VGSRR86 pKa = 11.84TVDD89 pKa = 3.34DD90 pKa = 4.75LSAVVQEE97 pKa = 5.2LDD99 pKa = 3.15ALQDD103 pKa = 3.36GGIQAGVAVTSLDD116 pKa = 3.32GSITLTYY123 pKa = 10.5QQDD126 pKa = 3.32QSFYY130 pKa = 10.35AASTIKK136 pKa = 10.6APYY139 pKa = 7.69VCAVLEE145 pKa = 4.15EE146 pKa = 4.7DD147 pKa = 4.67LPAGTTSMASLRR159 pKa = 11.84DD160 pKa = 3.64AMSSMLLYY168 pKa = 10.52SDD170 pKa = 3.66NDD172 pKa = 3.39SYY174 pKa = 11.69RR175 pKa = 11.84QLRR178 pKa = 11.84DD179 pKa = 3.07SYY181 pKa = 11.59GDD183 pKa = 3.77DD184 pKa = 4.59VFLTWLQRR192 pKa = 11.84HH193 pKa = 6.15DD194 pKa = 4.01VTAGTYY200 pKa = 10.71GSLSDD205 pKa = 4.12YY206 pKa = 11.36ARR208 pKa = 11.84DD209 pKa = 3.79HH210 pKa = 6.77YY211 pKa = 11.07PFSTPEE217 pKa = 3.76QLTQMWQAVWAFVSGDD233 pKa = 3.61AQGASYY239 pKa = 10.96LKK241 pKa = 10.6DD242 pKa = 3.08LLARR246 pKa = 11.84RR247 pKa = 11.84EE248 pKa = 3.96EE249 pKa = 4.3SPIANALGPQTEE261 pKa = 4.9TYY263 pKa = 10.67SKK265 pKa = 10.77AGWYY269 pKa = 9.61PEE271 pKa = 4.13TDD273 pKa = 3.56GSDD276 pKa = 3.21AAPASNDD283 pKa = 3.19AGVVIHH289 pKa = 6.69GSASTSYY296 pKa = 10.14VISVMSTAPSEE307 pKa = 4.08LDD309 pKa = 3.16RR310 pKa = 11.84LEE312 pKa = 4.36GLISAIDD319 pKa = 3.75HH320 pKa = 6.83LMDD323 pKa = 5.46ADD325 pKa = 4.15GAA327 pKa = 4.23
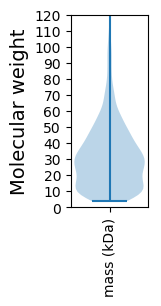
Molecular weight: 34.41 kDa
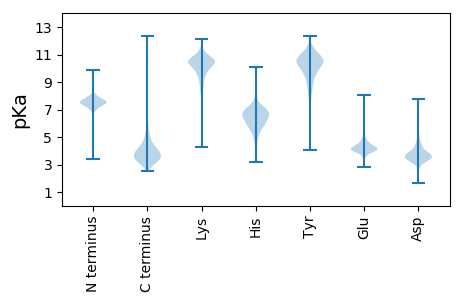
Isoelectric point according different methods:
Protein with the highest isoelectric point:
>tr|U2TID9|U2TID9_9ACTN Uncharacterized protein OS=Olsenella profusa F0195 OX=1125712 GN=HMPREF1316_0657 PE=4 SV=1
MM1 pKa = 7.35KK2 pKa = 9.42RR3 pKa = 11.84TYY5 pKa = 10.34QPNKK9 pKa = 8.62RR10 pKa = 11.84KK11 pKa = 9.56RR12 pKa = 11.84AKK14 pKa = 8.76THH16 pKa = 5.23GFRR19 pKa = 11.84ARR21 pKa = 11.84MASKK25 pKa = 10.41AGRR28 pKa = 11.84AVLSRR33 pKa = 11.84RR34 pKa = 11.84RR35 pKa = 11.84AKK37 pKa = 10.16GRR39 pKa = 11.84KK40 pKa = 8.12QLTVV44 pKa = 2.97
MM1 pKa = 7.35KK2 pKa = 9.42RR3 pKa = 11.84TYY5 pKa = 10.34QPNKK9 pKa = 8.62RR10 pKa = 11.84KK11 pKa = 9.56RR12 pKa = 11.84AKK14 pKa = 8.76THH16 pKa = 5.23GFRR19 pKa = 11.84ARR21 pKa = 11.84MASKK25 pKa = 10.41AGRR28 pKa = 11.84AVLSRR33 pKa = 11.84RR34 pKa = 11.84RR35 pKa = 11.84AKK37 pKa = 10.16GRR39 pKa = 11.84KK40 pKa = 8.12QLTVV44 pKa = 2.97
Molecular weight: 5.15 kDa
Isoelectric point according different methods:
Peptides (in silico digests for buttom-up proteomics)
Below you can find in silico digests of the whole proteome with Trypsin, Chymotrypsin, Trypsin+LysC, LysN, ArgC proteases suitable for different mass spec machines.| Try ESI |
 |
|---|
| ChTry ESI |
 |
|---|
| ArgC ESI |
 |
|---|
| LysN ESI |
 |
|---|
| TryLysC ESI |
 |
|---|
| Try MALDI |
 |
|---|
| ChTry MALDI |
 |
|---|
| ArgC MALDI |
 |
|---|
| LysN MALDI |
 |
|---|
| TryLysC MALDI |
 |
|---|
| Try LTQ |
 |
|---|
| ChTry LTQ |
 |
|---|
| ArgC LTQ |
 |
|---|
| LysN LTQ |
 |
|---|
| TryLysC LTQ |
 |
|---|
| Try MSlow |
 |
|---|
| ChTry MSlow |
 |
|---|
| ArgC MSlow |
 |
|---|
| LysN MSlow |
 |
|---|
| TryLysC MSlow |
 |
|---|
| Try MShigh |
 |
|---|
| ChTry MShigh |
 |
|---|
| ArgC MShigh |
 |
|---|
| LysN MShigh |
 |
|---|
| TryLysC MShigh |
 |
|---|
General Statistics
Number of major isoforms |
Number of additional isoforms |
Number of all proteins |
Number of amino acids |
Min. Seq. Length |
Max. Seq. Length |
Avg. Seq. Length |
Avg. Mol. Weight |
|---|---|---|---|---|---|---|---|
0 |
795533 |
33 |
1732 |
300.2 |
32.69 |
Amino acid frequency
Ala |
Cys |
Asp |
Glu |
Phe |
Gly |
His |
Ile |
Lys |
Leu |
|---|---|---|---|---|---|---|---|---|---|
10.992 ± 0.061 | 1.578 ± 0.019 |
6.457 ± 0.042 | 6.064 ± 0.049 |
3.287 ± 0.032 | 8.842 ± 0.049 |
2.239 ± 0.025 | 4.663 ± 0.038 |
2.898 ± 0.036 | 9.526 ± 0.055 |
Met |
Asn |
Gln |
Pro |
Arg |
Ser |
Thr |
Val |
Trp |
Tyr |
|---|---|---|---|---|---|---|---|---|---|
2.774 ± 0.019 | 2.512 ± 0.031 |
4.365 ± 0.037 | 2.926 ± 0.028 |
7.244 ± 0.059 | 5.989 ± 0.042 |
5.523 ± 0.034 | 8.177 ± 0.045 |
1.184 ± 0.02 | 2.762 ± 0.031 |
Most of the basic statistics you can see at this page can be downloaded from this CSV file
Proteome-pI is available under Creative Commons Attribution-NoDerivs license, for more details see here
| Reference: Kozlowski LP. Proteome-pI 2.0: Proteome Isoelectric Point Database Update. Nucleic Acids Res. 2021, doi: 10.1093/nar/gkab944 | Contact: Lukasz P. Kozlowski |
