Paraburkholderia sartisoli
Taxonomy: cellular organisms; Bacteria; Proteobacteria; Betaproteobacteria; Burkholderiales; Burkholderiaceae; Paraburkholderia
Average proteome isoelectric point is 6.74
Get precalculated fractions of proteins

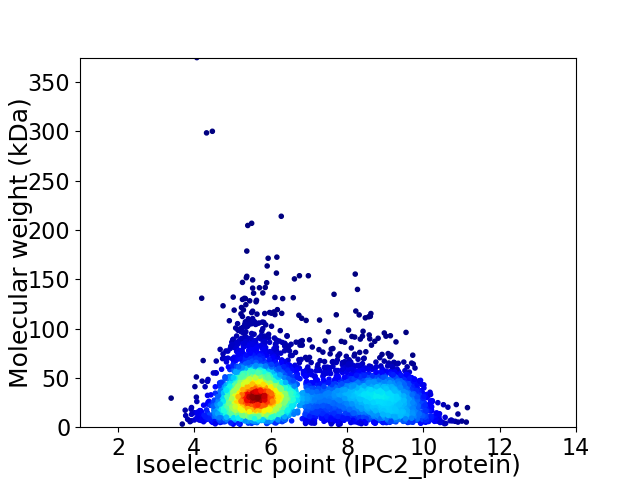
Virtual 2D-PAGE plot for 5332 proteins (isoelectric point calculated using IPC2_protein)
Get csv file with sequences according to given criteria:
* You can choose from 21 different methods for calculating isoelectric point
Summary statistics related to proteome-wise predictions


Protein with the lowest isoelectric point:
>tr|A0A1H4G7P0|A0A1H4G7P0_9BURK Cd(II)/Pb(II)-responsive transcriptional regulator OS=Paraburkholderia sartisoli OX=83784 GN=SAMN05192564_105368 PE=4 SV=1
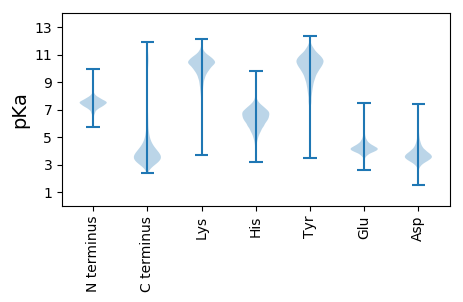
MM1 pKa = 8.03GYY3 pKa = 9.07QQGLSGLAGASSDD16 pKa = 4.56LDD18 pKa = 3.81VIGNNIANANTVGFKK33 pKa = 10.29QGSAQFADD41 pKa = 4.02MYY43 pKa = 10.58ANSVATAVNTQIGIGSRR60 pKa = 11.84LASVQQQFSQGTINTTNQALDD81 pKa = 3.33VAINGNGFFQMSNNGSLTYY100 pKa = 10.49SRR102 pKa = 11.84NGVFQLDD109 pKa = 3.58KK110 pKa = 11.41NGFIINADD118 pKa = 3.47GLEE121 pKa = 4.0LMGYY125 pKa = 9.03AANANGIINSANTVPLKK142 pKa = 11.05VPTANIPPTTTTTITAGLNLNAQDD166 pKa = 4.45PLVLGTPTTTPGGTNTAGLTGTAAITSNVAGTNANTYY203 pKa = 10.12LVTFTGPTTYY213 pKa = 9.71TVSVNGGPASAPATYY228 pKa = 7.64TTGTAITLGTGEE240 pKa = 4.53TLTLAGATPANGDD253 pKa = 3.73TFTVKK258 pKa = 9.1PTQVPFNQTDD268 pKa = 3.34NTTYY272 pKa = 10.61SYY274 pKa = 7.4PTSVPVYY281 pKa = 9.8DD282 pKa = 4.29SLGGAQQVDD291 pKa = 4.06MYY293 pKa = 10.3FVKK296 pKa = 9.91TAAGSWDD303 pKa = 3.55VYY305 pKa = 11.21AGVSTGTASKK315 pKa = 10.43IGTAKK320 pKa = 10.4FDD322 pKa = 3.52TSGNLVSTTDD332 pKa = 3.29NAGNPTATPLAFNFSIPTTDD352 pKa = 4.1GSATPQSLQLRR363 pKa = 11.84IGGTTQFGSKK373 pKa = 10.36DD374 pKa = 3.5GTNSLDD380 pKa = 3.57QNGFAAGTLTNFTIGQDD397 pKa = 3.33GTLTGNYY404 pKa = 10.23SNGQTAALGQIVLANFANQNGLVDD428 pKa = 5.02LGNNQYY434 pKa = 11.02GATAASGVAQISVPGSTNHH453 pKa = 5.88GTLQGGAVEE462 pKa = 4.37NSNVDD467 pKa = 3.69LTSEE471 pKa = 4.14LVNLITAQRR480 pKa = 11.84NYY482 pKa = 9.6QANAQTIKK490 pKa = 9.27TQQAVDD496 pKa = 3.37NTLINLL502 pKa = 4.1
MM1 pKa = 8.03GYY3 pKa = 9.07QQGLSGLAGASSDD16 pKa = 4.56LDD18 pKa = 3.81VIGNNIANANTVGFKK33 pKa = 10.29QGSAQFADD41 pKa = 4.02MYY43 pKa = 10.58ANSVATAVNTQIGIGSRR60 pKa = 11.84LASVQQQFSQGTINTTNQALDD81 pKa = 3.33VAINGNGFFQMSNNGSLTYY100 pKa = 10.49SRR102 pKa = 11.84NGVFQLDD109 pKa = 3.58KK110 pKa = 11.41NGFIINADD118 pKa = 3.47GLEE121 pKa = 4.0LMGYY125 pKa = 9.03AANANGIINSANTVPLKK142 pKa = 11.05VPTANIPPTTTTTITAGLNLNAQDD166 pKa = 4.45PLVLGTPTTTPGGTNTAGLTGTAAITSNVAGTNANTYY203 pKa = 10.12LVTFTGPTTYY213 pKa = 9.71TVSVNGGPASAPATYY228 pKa = 7.64TTGTAITLGTGEE240 pKa = 4.53TLTLAGATPANGDD253 pKa = 3.73TFTVKK258 pKa = 9.1PTQVPFNQTDD268 pKa = 3.34NTTYY272 pKa = 10.61SYY274 pKa = 7.4PTSVPVYY281 pKa = 9.8DD282 pKa = 4.29SLGGAQQVDD291 pKa = 4.06MYY293 pKa = 10.3FVKK296 pKa = 9.91TAAGSWDD303 pKa = 3.55VYY305 pKa = 11.21AGVSTGTASKK315 pKa = 10.43IGTAKK320 pKa = 10.4FDD322 pKa = 3.52TSGNLVSTTDD332 pKa = 3.29NAGNPTATPLAFNFSIPTTDD352 pKa = 4.1GSATPQSLQLRR363 pKa = 11.84IGGTTQFGSKK373 pKa = 10.36DD374 pKa = 3.5GTNSLDD380 pKa = 3.57QNGFAAGTLTNFTIGQDD397 pKa = 3.33GTLTGNYY404 pKa = 10.23SNGQTAALGQIVLANFANQNGLVDD428 pKa = 5.02LGNNQYY434 pKa = 11.02GATAASGVAQISVPGSTNHH453 pKa = 5.88GTLQGGAVEE462 pKa = 4.37NSNVDD467 pKa = 3.69LTSEE471 pKa = 4.14LVNLITAQRR480 pKa = 11.84NYY482 pKa = 9.6QANAQTIKK490 pKa = 9.27TQQAVDD496 pKa = 3.37NTLINLL502 pKa = 4.1
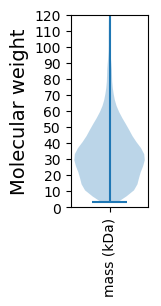
Molecular weight: 50.95 kDa
Isoelectric point according different methods:
Protein with the highest isoelectric point:
>tr|A0A1H3ZBF2|A0A1H3ZBF2_9BURK 2-polyprenyl-6-methoxyphenol hydroxylase OS=Paraburkholderia sartisoli OX=83784 GN=SAMN05192564_101667 PE=4 SV=1
MM1 pKa = 7.99RR2 pKa = 11.84ARR4 pKa = 11.84TRR6 pKa = 11.84IRR8 pKa = 11.84LQTQTQTQTQTQTQTQTQTQTQTQVQVQVQVQVQVRR44 pKa = 11.84MRR46 pKa = 11.84MRR48 pKa = 11.84VWVV51 pKa = 3.59
MM1 pKa = 7.99RR2 pKa = 11.84ARR4 pKa = 11.84TRR6 pKa = 11.84IRR8 pKa = 11.84LQTQTQTQTQTQTQTQTQTQTQTQVQVQVQVQVQVRR44 pKa = 11.84MRR46 pKa = 11.84MRR48 pKa = 11.84VWVV51 pKa = 3.59
Molecular weight: 6.17 kDa
Isoelectric point according different methods:
Peptides (in silico digests for buttom-up proteomics)
Below you can find in silico digests of the whole proteome with Trypsin, Chymotrypsin, Trypsin+LysC, LysN, ArgC proteases suitable for different mass spec machines.| Try ESI |
 |
|---|
| ChTry ESI |
 |
|---|
| ArgC ESI |
 |
|---|
| LysN ESI |
 |
|---|
| TryLysC ESI |
 |
|---|
| Try MALDI |
 |
|---|
| ChTry MALDI |
 |
|---|
| ArgC MALDI |
 |
|---|
| LysN MALDI |
 |
|---|
| TryLysC MALDI |
 |
|---|
| Try LTQ |
 |
|---|
| ChTry LTQ |
 |
|---|
| ArgC LTQ |
 |
|---|
| LysN LTQ |
 |
|---|
| TryLysC LTQ |
 |
|---|
| Try MSlow |
 |
|---|
| ChTry MSlow |
 |
|---|
| ArgC MSlow |
 |
|---|
| LysN MSlow |
 |
|---|
| TryLysC MSlow |
 |
|---|
| Try MShigh |
 |
|---|
| ChTry MShigh |
 |
|---|
| ArgC MShigh |
 |
|---|
| LysN MShigh |
 |
|---|
| TryLysC MShigh |
 |
|---|
General Statistics
Number of major isoforms |
Number of additional isoforms |
Number of all proteins |
Number of amino acids |
Min. Seq. Length |
Max. Seq. Length |
Avg. Seq. Length |
Avg. Mol. Weight |
|---|---|---|---|---|---|---|---|
0 |
1708161 |
26 |
3849 |
320.4 |
34.75 |
Amino acid frequency
Ala |
Cys |
Asp |
Glu |
Phe |
Gly |
His |
Ile |
Lys |
Leu |
|---|---|---|---|---|---|---|---|---|---|
12.611 ± 0.042 | 0.924 ± 0.011 |
5.445 ± 0.025 | 5.049 ± 0.037 |
3.749 ± 0.022 | 8.252 ± 0.039 |
2.352 ± 0.017 | 4.786 ± 0.024 |
3.09 ± 0.029 | 10.122 ± 0.039 |
Met |
Asn |
Gln |
Pro |
Arg |
Ser |
Thr |
Val |
Trp |
Tyr |
|---|---|---|---|---|---|---|---|---|---|
2.421 ± 0.015 | 2.827 ± 0.026 |
5.075 ± 0.026 | 3.519 ± 0.025 |
6.892 ± 0.035 | 5.622 ± 0.032 |
5.608 ± 0.031 | 7.908 ± 0.023 |
1.354 ± 0.015 | 2.394 ± 0.017 |
Most of the basic statistics you can see at this page can be downloaded from this CSV file
Proteome-pI is available under Creative Commons Attribution-NoDerivs license, for more details see here
| Reference: Kozlowski LP. Proteome-pI 2.0: Proteome Isoelectric Point Database Update. Nucleic Acids Res. 2021, doi: 10.1093/nar/gkab944 | Contact: Lukasz P. Kozlowski |
