Midichloria mitochondrii (strain IricVA)
Taxonomy: cellular organisms; Bacteria; Proteobacteria; Alphaproteobacteria; Rickettsiales; Candidatus Midichloriaceae; Candidatus Midichloria; Candidatus Midichloria mitochondrii
Average proteome isoelectric point is 7.2
Get precalculated fractions of proteins

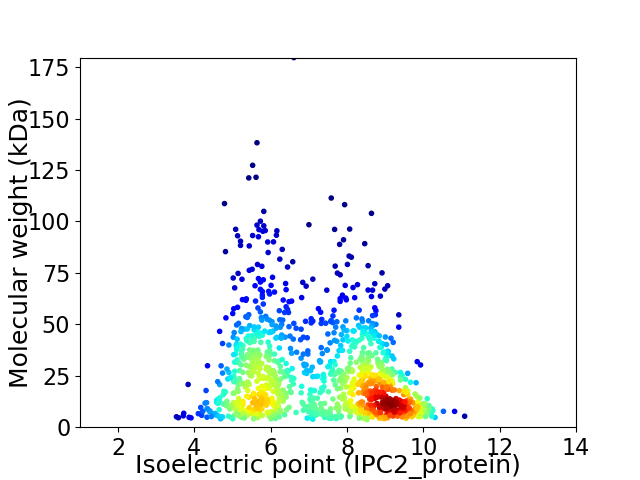
Virtual 2D-PAGE plot for 1181 proteins (isoelectric point calculated using IPC2_protein)
Get csv file with sequences according to given criteria:
* You can choose from 21 different methods for calculating isoelectric point
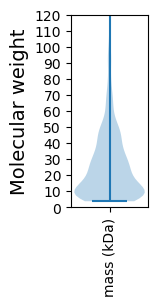
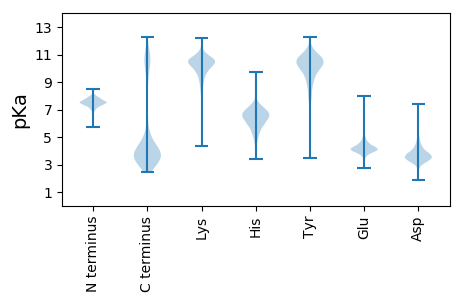
Summary statistics related to proteome-wise predictions


Protein with the lowest isoelectric point:
>tr|F7XVN0|F7XVN0_MIDMI Lipoyl synthase OS=Midichloria mitochondrii (strain IricVA) OX=696127 GN=lipA PE=3 SV=1
MM1 pKa = 7.59INYY4 pKa = 8.02NHH6 pKa = 6.66NPTLSVTQTDD16 pKa = 4.12LEE18 pKa = 4.81DD19 pKa = 3.38NSGIQKK25 pKa = 10.24LYY27 pKa = 10.47PSLTDD32 pKa = 3.56LQEE35 pKa = 3.84NFAYY39 pKa = 10.22EE40 pKa = 4.55NYY42 pKa = 10.78NPMLYY47 pKa = 7.33TTHH50 pKa = 7.11GDD52 pKa = 3.57LEE54 pKa = 4.59TSEE57 pKa = 4.54DD58 pKa = 3.83TYY60 pKa = 11.31EE61 pKa = 4.18APKK64 pKa = 10.34PSAPTEE70 pKa = 4.32SEE72 pKa = 4.14LQPSLACGAPEE83 pKa = 3.74PSAPKK88 pKa = 8.8EE89 pKa = 4.32TEE91 pKa = 3.99PEE93 pKa = 3.83SDD95 pKa = 3.1LAAASVEE102 pKa = 4.54SQFEE106 pKa = 3.89ADD108 pKa = 3.85LQADD112 pKa = 3.6IALEE116 pKa = 3.97EE117 pKa = 4.44SRR119 pKa = 11.84FEE121 pKa = 5.16ADD123 pKa = 2.84MQAAITASLEE133 pKa = 4.31DD134 pKa = 4.2KK135 pKa = 10.51FQADD139 pKa = 3.58IEE141 pKa = 4.56TATAASLKK149 pKa = 9.27KK150 pKa = 8.82TGSSVYY156 pKa = 10.54SYY158 pKa = 11.32DD159 pKa = 3.9PYY161 pKa = 10.91QSCSSAFRR169 pKa = 11.84SEE171 pKa = 4.3DD172 pKa = 3.67YY173 pKa = 10.4FWEE176 pKa = 4.92AGHH179 pKa = 6.82SNLDD183 pKa = 3.76SDD185 pKa = 4.12WVIAA189 pKa = 4.48
MM1 pKa = 7.59INYY4 pKa = 8.02NHH6 pKa = 6.66NPTLSVTQTDD16 pKa = 4.12LEE18 pKa = 4.81DD19 pKa = 3.38NSGIQKK25 pKa = 10.24LYY27 pKa = 10.47PSLTDD32 pKa = 3.56LQEE35 pKa = 3.84NFAYY39 pKa = 10.22EE40 pKa = 4.55NYY42 pKa = 10.78NPMLYY47 pKa = 7.33TTHH50 pKa = 7.11GDD52 pKa = 3.57LEE54 pKa = 4.59TSEE57 pKa = 4.54DD58 pKa = 3.83TYY60 pKa = 11.31EE61 pKa = 4.18APKK64 pKa = 10.34PSAPTEE70 pKa = 4.32SEE72 pKa = 4.14LQPSLACGAPEE83 pKa = 3.74PSAPKK88 pKa = 8.8EE89 pKa = 4.32TEE91 pKa = 3.99PEE93 pKa = 3.83SDD95 pKa = 3.1LAAASVEE102 pKa = 4.54SQFEE106 pKa = 3.89ADD108 pKa = 3.85LQADD112 pKa = 3.6IALEE116 pKa = 3.97EE117 pKa = 4.44SRR119 pKa = 11.84FEE121 pKa = 5.16ADD123 pKa = 2.84MQAAITASLEE133 pKa = 4.31DD134 pKa = 4.2KK135 pKa = 10.51FQADD139 pKa = 3.58IEE141 pKa = 4.56TATAASLKK149 pKa = 9.27KK150 pKa = 8.82TGSSVYY156 pKa = 10.54SYY158 pKa = 11.32DD159 pKa = 3.9PYY161 pKa = 10.91QSCSSAFRR169 pKa = 11.84SEE171 pKa = 4.3DD172 pKa = 3.67YY173 pKa = 10.4FWEE176 pKa = 4.92AGHH179 pKa = 6.82SNLDD183 pKa = 3.76SDD185 pKa = 4.12WVIAA189 pKa = 4.48
Molecular weight: 20.78 kDa
Isoelectric point according different methods:
Protein with the highest isoelectric point:
>tr|F7XTZ2|F7XTZ2_MIDMI Flagellar hook-associated protein FlgK putative OS=Midichloria mitochondrii (strain IricVA) OX=696127 GN=flgK PE=4 SV=1
MM1 pKa = 6.51STKK4 pKa = 9.4RR5 pKa = 11.84TYY7 pKa = 10.43QPSKK11 pKa = 9.73LVRR14 pKa = 11.84KK15 pKa = 9.15RR16 pKa = 11.84RR17 pKa = 11.84HH18 pKa = 4.42GFRR21 pKa = 11.84ARR23 pKa = 11.84MATVGGRR30 pKa = 11.84KK31 pKa = 8.92ILNNRR36 pKa = 11.84RR37 pKa = 11.84AQGRR41 pKa = 11.84KK42 pKa = 8.96VLSAA46 pKa = 3.99
MM1 pKa = 6.51STKK4 pKa = 9.4RR5 pKa = 11.84TYY7 pKa = 10.43QPSKK11 pKa = 9.73LVRR14 pKa = 11.84KK15 pKa = 9.15RR16 pKa = 11.84RR17 pKa = 11.84HH18 pKa = 4.42GFRR21 pKa = 11.84ARR23 pKa = 11.84MATVGGRR30 pKa = 11.84KK31 pKa = 8.92ILNNRR36 pKa = 11.84RR37 pKa = 11.84AQGRR41 pKa = 11.84KK42 pKa = 8.96VLSAA46 pKa = 3.99
Molecular weight: 5.34 kDa
Isoelectric point according different methods:
Peptides (in silico digests for buttom-up proteomics)
Below you can find in silico digests of the whole proteome with Trypsin, Chymotrypsin, Trypsin+LysC, LysN, ArgC proteases suitable for different mass spec machines.| Try ESI |
 |
|---|
| ChTry ESI |
 |
|---|
| ArgC ESI |
 |
|---|
| LysN ESI |
 |
|---|
| TryLysC ESI |
 |
|---|
| Try MALDI |
 |
|---|
| ChTry MALDI |
 |
|---|
| ArgC MALDI |
 |
|---|
| LysN MALDI |
 |
|---|
| TryLysC MALDI |
 |
|---|
| Try LTQ |
 |
|---|
| ChTry LTQ |
 |
|---|
| ArgC LTQ |
 |
|---|
| LysN LTQ |
 |
|---|
| TryLysC LTQ |
 |
|---|
| Try MSlow |
 |
|---|
| ChTry MSlow |
 |
|---|
| ArgC MSlow |
 |
|---|
| LysN MSlow |
 |
|---|
| TryLysC MSlow |
 |
|---|
| Try MShigh |
 |
|---|
| ChTry MShigh |
 |
|---|
| ArgC MShigh |
 |
|---|
| LysN MShigh |
 |
|---|
| TryLysC MShigh |
 |
|---|
General Statistics
Number of major isoforms |
Number of additional isoforms |
Number of all proteins |
Number of amino acids |
Min. Seq. Length |
Max. Seq. Length |
Avg. Seq. Length |
Avg. Mol. Weight |
|---|---|---|---|---|---|---|---|
0 |
280672 |
37 |
1582 |
237.7 |
26.64 |
Amino acid frequency
Ala |
Cys |
Asp |
Glu |
Phe |
Gly |
His |
Ile |
Lys |
Leu |
|---|---|---|---|---|---|---|---|---|---|
7.327 ± 0.085 | 1.129 ± 0.027 |
4.769 ± 0.058 | 6.243 ± 0.077 |
4.703 ± 0.064 | 6.109 ± 0.059 |
1.877 ± 0.034 | 9.125 ± 0.071 |
7.623 ± 0.069 | 10.163 ± 0.077 |
Met |
Asn |
Gln |
Pro |
Arg |
Ser |
Thr |
Val |
Trp |
Tyr |
|---|---|---|---|---|---|---|---|---|---|
2.399 ± 0.036 | 5.427 ± 0.058 |
3.343 ± 0.049 | 3.29 ± 0.045 |
4.1 ± 0.054 | 7.047 ± 0.066 |
4.833 ± 0.04 | 6.274 ± 0.062 |
0.827 ± 0.024 | 3.392 ± 0.048 |
Most of the basic statistics you can see at this page can be downloaded from this CSV file
Proteome-pI is available under Creative Commons Attribution-NoDerivs license, for more details see here
| Reference: Kozlowski LP. Proteome-pI 2.0: Proteome Isoelectric Point Database Update. Nucleic Acids Res. 2021, doi: 10.1093/nar/gkab944 | Contact: Lukasz P. Kozlowski |
