Pseudomonas kirkiae
Taxonomy: cellular organisms; Bacteria; Proteobacteria; Gammaproteobacteria; Pseudomonadales; Pseudomonadaceae; Pseudomonas
Average proteome isoelectric point is 6.4
Get precalculated fractions of proteins

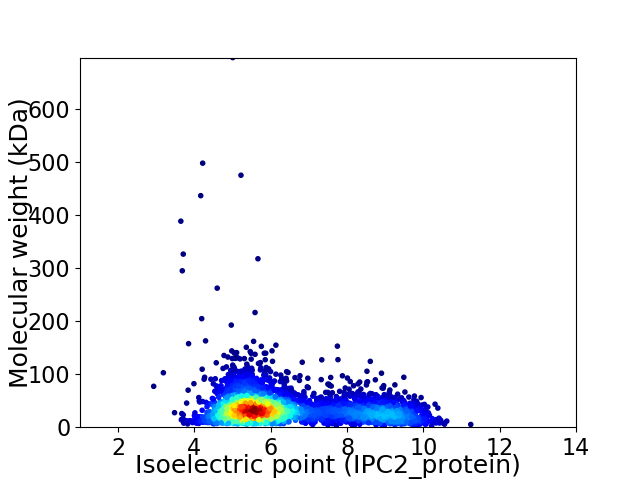
Virtual 2D-PAGE plot for 3666 proteins (isoelectric point calculated using IPC2_protein)
Get csv file with sequences according to given criteria:
* You can choose from 21 different methods for calculating isoelectric point
Summary statistics related to proteome-wise predictions


Protein with the lowest isoelectric point:
>tr|A0A4Q9RGK9|A0A4Q9RGK9_9PSED 50S ribosomal protein L35 OS=Pseudomonas kirkiae OX=2211392 GN=rpmI PE=3 SV=1
MM1 pKa = 7.51SFNTALSGLKK11 pKa = 10.05AASTYY16 pKa = 11.37LNVTGNNIANTGTTGFKK33 pKa = 10.26YY34 pKa = 10.64SRR36 pKa = 11.84AEE38 pKa = 3.81FADD41 pKa = 4.99LYY43 pKa = 10.02ASSMFGTGSNSVGSGVLTSDD63 pKa = 3.48IAQQFTQGNITYY75 pKa = 9.19TDD77 pKa = 3.27NSLDD81 pKa = 3.66LAINGSGYY89 pKa = 10.6FIVNDD94 pKa = 4.64GGSQLYY100 pKa = 8.44TRR102 pKa = 11.84SGAFKK107 pKa = 10.66VDD109 pKa = 3.31NQGNVVDD116 pKa = 4.28SSGNNLMGYY125 pKa = 10.2GVDD128 pKa = 3.7SDD130 pKa = 4.32GNLVNGVLTNLVVDD144 pKa = 4.34TTNQEE149 pKa = 4.17PNATTSVTQSLALNSAASLPTTTPFDD175 pKa = 3.96SSISTSYY182 pKa = 10.66NWSTSATLYY191 pKa = 10.59DD192 pKa = 3.99SQGNAHH198 pKa = 6.07TMSQYY203 pKa = 10.17FVKK206 pKa = 10.01TDD208 pKa = 3.31SNEE211 pKa = 2.98WSMYY215 pKa = 9.69VLVDD219 pKa = 3.23GRR221 pKa = 11.84NPQDD225 pKa = 3.49PTSTDD230 pKa = 3.25PYY232 pKa = 9.87EE233 pKa = 4.51ASLPFTTAGKK243 pKa = 10.55LDD245 pKa = 3.68TSNLASGDD253 pKa = 3.5FTINADD259 pKa = 3.63GTLSLSDD266 pKa = 3.63WVPAAISDD274 pKa = 3.81ATTDD278 pKa = 3.66PVTWASNGAAASTSGITLDD297 pKa = 4.58LRR299 pKa = 11.84TMTQTNTSFSVNSLYY314 pKa = 10.45QDD316 pKa = 3.97GYY318 pKa = 8.16TTGQLSGLSVDD329 pKa = 3.5EE330 pKa = 4.39TGQLFATYY338 pKa = 10.14TNGQSKK344 pKa = 10.98VIGQTALATFANMQGLTPVGGTAWRR369 pKa = 11.84QSLASGEE376 pKa = 4.24PVIGTPGSGTLGAIAAGALEE396 pKa = 4.81DD397 pKa = 4.35SNVDD401 pKa = 3.56LTSQLVDD408 pKa = 4.98LIVAQRR414 pKa = 11.84NYY416 pKa = 9.59QANAKK421 pKa = 9.2TIEE424 pKa = 4.16TEE426 pKa = 3.93NTISQTIINIRR437 pKa = 3.35
MM1 pKa = 7.51SFNTALSGLKK11 pKa = 10.05AASTYY16 pKa = 11.37LNVTGNNIANTGTTGFKK33 pKa = 10.26YY34 pKa = 10.64SRR36 pKa = 11.84AEE38 pKa = 3.81FADD41 pKa = 4.99LYY43 pKa = 10.02ASSMFGTGSNSVGSGVLTSDD63 pKa = 3.48IAQQFTQGNITYY75 pKa = 9.19TDD77 pKa = 3.27NSLDD81 pKa = 3.66LAINGSGYY89 pKa = 10.6FIVNDD94 pKa = 4.64GGSQLYY100 pKa = 8.44TRR102 pKa = 11.84SGAFKK107 pKa = 10.66VDD109 pKa = 3.31NQGNVVDD116 pKa = 4.28SSGNNLMGYY125 pKa = 10.2GVDD128 pKa = 3.7SDD130 pKa = 4.32GNLVNGVLTNLVVDD144 pKa = 4.34TTNQEE149 pKa = 4.17PNATTSVTQSLALNSAASLPTTTPFDD175 pKa = 3.96SSISTSYY182 pKa = 10.66NWSTSATLYY191 pKa = 10.59DD192 pKa = 3.99SQGNAHH198 pKa = 6.07TMSQYY203 pKa = 10.17FVKK206 pKa = 10.01TDD208 pKa = 3.31SNEE211 pKa = 2.98WSMYY215 pKa = 9.69VLVDD219 pKa = 3.23GRR221 pKa = 11.84NPQDD225 pKa = 3.49PTSTDD230 pKa = 3.25PYY232 pKa = 9.87EE233 pKa = 4.51ASLPFTTAGKK243 pKa = 10.55LDD245 pKa = 3.68TSNLASGDD253 pKa = 3.5FTINADD259 pKa = 3.63GTLSLSDD266 pKa = 3.63WVPAAISDD274 pKa = 3.81ATTDD278 pKa = 3.66PVTWASNGAAASTSGITLDD297 pKa = 4.58LRR299 pKa = 11.84TMTQTNTSFSVNSLYY314 pKa = 10.45QDD316 pKa = 3.97GYY318 pKa = 8.16TTGQLSGLSVDD329 pKa = 3.5EE330 pKa = 4.39TGQLFATYY338 pKa = 10.14TNGQSKK344 pKa = 10.98VIGQTALATFANMQGLTPVGGTAWRR369 pKa = 11.84QSLASGEE376 pKa = 4.24PVIGTPGSGTLGAIAAGALEE396 pKa = 4.81DD397 pKa = 4.35SNVDD401 pKa = 3.56LTSQLVDD408 pKa = 4.98LIVAQRR414 pKa = 11.84NYY416 pKa = 9.59QANAKK421 pKa = 9.2TIEE424 pKa = 4.16TEE426 pKa = 3.93NTISQTIINIRR437 pKa = 3.35
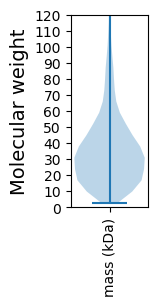
Molecular weight: 45.55 kDa
Isoelectric point according different methods:
Protein with the highest isoelectric point:
>tr|A0A4Q9REN9|A0A4Q9REN9_9PSED Methyl-accepting chemotaxis protein OS=Pseudomonas kirkiae OX=2211392 GN=DNJ96_03035 PE=4 SV=1
MM1 pKa = 7.45KK2 pKa = 9.56RR3 pKa = 11.84TFQPSTIKK11 pKa = 10.52RR12 pKa = 11.84ARR14 pKa = 11.84THH16 pKa = 5.94GFRR19 pKa = 11.84ARR21 pKa = 11.84MATKK25 pKa = 10.16NGRR28 pKa = 11.84AVLSRR33 pKa = 11.84RR34 pKa = 11.84RR35 pKa = 11.84AKK37 pKa = 9.83GRR39 pKa = 11.84KK40 pKa = 8.88RR41 pKa = 11.84LTVV44 pKa = 3.11
MM1 pKa = 7.45KK2 pKa = 9.56RR3 pKa = 11.84TFQPSTIKK11 pKa = 10.52RR12 pKa = 11.84ARR14 pKa = 11.84THH16 pKa = 5.94GFRR19 pKa = 11.84ARR21 pKa = 11.84MATKK25 pKa = 10.16NGRR28 pKa = 11.84AVLSRR33 pKa = 11.84RR34 pKa = 11.84RR35 pKa = 11.84AKK37 pKa = 9.83GRR39 pKa = 11.84KK40 pKa = 8.88RR41 pKa = 11.84LTVV44 pKa = 3.11
Molecular weight: 5.15 kDa
Isoelectric point according different methods:
Peptides (in silico digests for buttom-up proteomics)
Below you can find in silico digests of the whole proteome with Trypsin, Chymotrypsin, Trypsin+LysC, LysN, ArgC proteases suitable for different mass spec machines.| Try ESI |
 |
|---|
| ChTry ESI |
 |
|---|
| ArgC ESI |
 |
|---|
| LysN ESI |
 |
|---|
| TryLysC ESI |
 |
|---|
| Try MALDI |
 |
|---|
| ChTry MALDI |
 |
|---|
| ArgC MALDI |
 |
|---|
| LysN MALDI |
 |
|---|
| TryLysC MALDI |
 |
|---|
| Try LTQ |
 |
|---|
| ChTry LTQ |
 |
|---|
| ArgC LTQ |
 |
|---|
| LysN LTQ |
 |
|---|
| TryLysC LTQ |
 |
|---|
| Try MSlow |
 |
|---|
| ChTry MSlow |
 |
|---|
| ArgC MSlow |
 |
|---|
| LysN MSlow |
 |
|---|
| TryLysC MSlow |
 |
|---|
| Try MShigh |
 |
|---|
| ChTry MShigh |
 |
|---|
| ArgC MShigh |
 |
|---|
| LysN MShigh |
 |
|---|
| TryLysC MShigh |
 |
|---|
General Statistics
Number of major isoforms |
Number of additional isoforms |
Number of all proteins |
Number of amino acids |
Min. Seq. Length |
Max. Seq. Length |
Avg. Seq. Length |
Avg. Mol. Weight |
|---|---|---|---|---|---|---|---|
0 |
1248603 |
23 |
6256 |
340.6 |
37.37 |
Amino acid frequency
Ala |
Cys |
Asp |
Glu |
Phe |
Gly |
His |
Ile |
Lys |
Leu |
|---|---|---|---|---|---|---|---|---|---|
11.109 ± 0.056 | 0.925 ± 0.012 |
5.432 ± 0.035 | 6.056 ± 0.046 |
3.45 ± 0.026 | 8.291 ± 0.053 |
2.281 ± 0.02 | 4.691 ± 0.028 |
2.813 ± 0.04 | 12.302 ± 0.067 |
Met |
Asn |
Gln |
Pro |
Arg |
Ser |
Thr |
Val |
Trp |
Tyr |
|---|---|---|---|---|---|---|---|---|---|
2.015 ± 0.018 | 2.848 ± 0.032 |
4.735 ± 0.031 | 4.646 ± 0.035 |
7.281 ± 0.049 | 5.976 ± 0.049 |
4.51 ± 0.043 | 6.706 ± 0.04 |
1.402 ± 0.018 | 2.533 ± 0.025 |
Most of the basic statistics you can see at this page can be downloaded from this CSV file
Proteome-pI is available under Creative Commons Attribution-NoDerivs license, for more details see here
| Reference: Kozlowski LP. Proteome-pI 2.0: Proteome Isoelectric Point Database Update. Nucleic Acids Res. 2021, doi: 10.1093/nar/gkab944 | Contact: Lukasz P. Kozlowski |
