Microcystis aeruginosa Ma_AC_P_19900807_S299
Taxonomy: cellular organisms; Bacteria; Terrabacteria group; Cyanobacteria/Melainabacteria group; Cyanobacteria; Oscillatoriophycideae; Chroococcales; Microcystaceae; Microcystis; Microcystis aeruginosa
Average proteome isoelectric point is 6.25
Get precalculated fractions of proteins

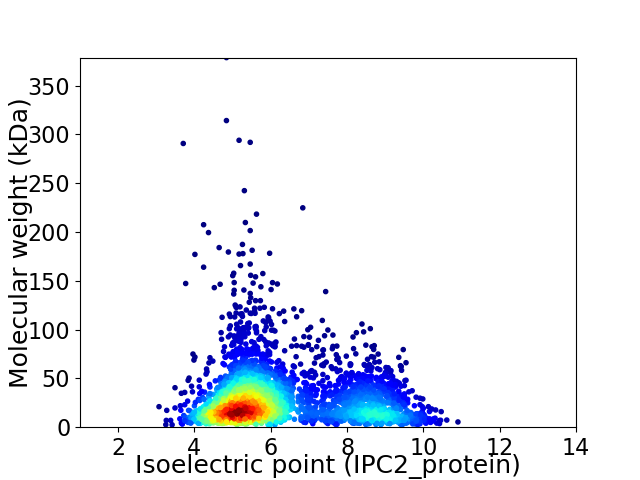
Virtual 2D-PAGE plot for 3434 proteins (isoelectric point calculated using IPC2_protein)
Get csv file with sequences according to given criteria:
* You can choose from 21 different methods for calculating isoelectric point
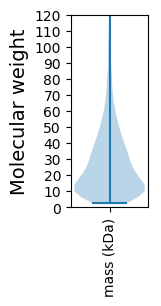
Summary statistics related to proteome-wise predictions


Protein with the lowest isoelectric point:
>tr|A0A552A7E3|A0A552A7E3_MICAE DNA polymerase subunit beta OS=Microcystis aeruginosa Ma_AC_P_19900807_S299 OX=2486264 GN=EWV82_13020 PE=4 SV=1
MM1 pKa = 7.56FDD3 pKa = 3.03STGIQLRR10 pKa = 11.84VSDD13 pKa = 5.48DD14 pKa = 3.51NPAPNEE20 pKa = 3.97PFSGDD25 pKa = 3.23SYY27 pKa = 11.7IDD29 pKa = 3.23FTASVSGTYY38 pKa = 9.56YY39 pKa = 10.72VGVSGYY45 pKa = 11.35SNFSYY50 pKa = 11.17NPFIDD55 pKa = 3.92GSGALSSSYY64 pKa = 11.32GDD66 pKa = 3.3YY67 pKa = 10.48TLEE70 pKa = 4.05IKK72 pKa = 10.62VGSGGSTNQVVLSEE86 pKa = 4.34PNNIISQAVDD96 pKa = 3.04SGLSSANQGIFIGTGSIRR114 pKa = 11.84TDD116 pKa = 3.22TNPITFFNGIITADD130 pKa = 3.52VGTLSSGEE138 pKa = 4.26SATIDD143 pKa = 3.43LTLSSIAAGNFNSTTIVTSNEE164 pKa = 3.53SDD166 pKa = 3.87ANPLDD171 pKa = 3.68NLIAGTQAVNSIAPAEE187 pKa = 4.23IDD189 pKa = 4.21LEE191 pKa = 4.27LTQTVNNSNPAIGDD205 pKa = 4.09EE206 pKa = 4.16ITLTLTLTNIGPGVASNIQVTNVLPLDD233 pKa = 3.55LAFISVVAEE242 pKa = 3.55QGTYY246 pKa = 10.91DD247 pKa = 4.13SNTGIWDD254 pKa = 3.61VGNMRR259 pKa = 11.84DD260 pKa = 3.62NLSRR264 pKa = 11.84TLTLTAQVNGGQSLTNTAQVTAVFEE289 pKa = 4.63ADD291 pKa = 4.32LDD293 pKa = 4.56SIPNNNDD300 pKa = 3.14CARR303 pKa = 11.84KK304 pKa = 9.4QNLNGFRR311 pKa = 11.84RR312 pKa = 11.84CVFYY316 pKa = 10.39FPQYY320 pKa = 10.05FYY322 pKa = 11.72ANRR325 pKa = 11.84WEE327 pKa = 4.05WW328 pKa = 3.01
MM1 pKa = 7.56FDD3 pKa = 3.03STGIQLRR10 pKa = 11.84VSDD13 pKa = 5.48DD14 pKa = 3.51NPAPNEE20 pKa = 3.97PFSGDD25 pKa = 3.23SYY27 pKa = 11.7IDD29 pKa = 3.23FTASVSGTYY38 pKa = 9.56YY39 pKa = 10.72VGVSGYY45 pKa = 11.35SNFSYY50 pKa = 11.17NPFIDD55 pKa = 3.92GSGALSSSYY64 pKa = 11.32GDD66 pKa = 3.3YY67 pKa = 10.48TLEE70 pKa = 4.05IKK72 pKa = 10.62VGSGGSTNQVVLSEE86 pKa = 4.34PNNIISQAVDD96 pKa = 3.04SGLSSANQGIFIGTGSIRR114 pKa = 11.84TDD116 pKa = 3.22TNPITFFNGIITADD130 pKa = 3.52VGTLSSGEE138 pKa = 4.26SATIDD143 pKa = 3.43LTLSSIAAGNFNSTTIVTSNEE164 pKa = 3.53SDD166 pKa = 3.87ANPLDD171 pKa = 3.68NLIAGTQAVNSIAPAEE187 pKa = 4.23IDD189 pKa = 4.21LEE191 pKa = 4.27LTQTVNNSNPAIGDD205 pKa = 4.09EE206 pKa = 4.16ITLTLTLTNIGPGVASNIQVTNVLPLDD233 pKa = 3.55LAFISVVAEE242 pKa = 3.55QGTYY246 pKa = 10.91DD247 pKa = 4.13SNTGIWDD254 pKa = 3.61VGNMRR259 pKa = 11.84DD260 pKa = 3.62NLSRR264 pKa = 11.84TLTLTAQVNGGQSLTNTAQVTAVFEE289 pKa = 4.63ADD291 pKa = 4.32LDD293 pKa = 4.56SIPNNNDD300 pKa = 3.14CARR303 pKa = 11.84KK304 pKa = 9.4QNLNGFRR311 pKa = 11.84RR312 pKa = 11.84CVFYY316 pKa = 10.39FPQYY320 pKa = 10.05FYY322 pKa = 11.72ANRR325 pKa = 11.84WEE327 pKa = 4.05WW328 pKa = 3.01
Molecular weight: 34.74 kDa
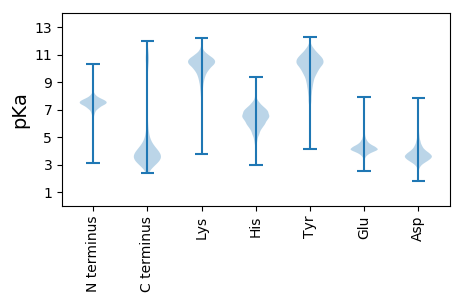
Isoelectric point according different methods:
Protein with the highest isoelectric point:
>tr|A0A551ZU75|A0A551ZU75_MICAE Glycogen debranching protein (Fragment) OS=Microcystis aeruginosa Ma_AC_P_19900807_S299 OX=2486264 GN=EWV82_20370 PE=4 SV=1
MM1 pKa = 7.79SKK3 pKa = 8.99RR4 pKa = 11.84TLEE7 pKa = 3.95GTTRR11 pKa = 11.84KK12 pKa = 9.34QKK14 pKa = 8.98RR15 pKa = 11.84TSGFRR20 pKa = 11.84ARR22 pKa = 11.84MRR24 pKa = 11.84SVNGRR29 pKa = 11.84KK30 pKa = 9.33VIKK33 pKa = 10.18ARR35 pKa = 11.84RR36 pKa = 11.84KK37 pKa = 7.72RR38 pKa = 11.84GRR40 pKa = 11.84YY41 pKa = 8.57RR42 pKa = 11.84LSVV45 pKa = 3.14
MM1 pKa = 7.79SKK3 pKa = 8.99RR4 pKa = 11.84TLEE7 pKa = 3.95GTTRR11 pKa = 11.84KK12 pKa = 9.34QKK14 pKa = 8.98RR15 pKa = 11.84TSGFRR20 pKa = 11.84ARR22 pKa = 11.84MRR24 pKa = 11.84SVNGRR29 pKa = 11.84KK30 pKa = 9.33VIKK33 pKa = 10.18ARR35 pKa = 11.84RR36 pKa = 11.84KK37 pKa = 7.72RR38 pKa = 11.84GRR40 pKa = 11.84YY41 pKa = 8.57RR42 pKa = 11.84LSVV45 pKa = 3.14
Molecular weight: 5.37 kDa
Isoelectric point according different methods:
Peptides (in silico digests for buttom-up proteomics)
Below you can find in silico digests of the whole proteome with Trypsin, Chymotrypsin, Trypsin+LysC, LysN, ArgC proteases suitable for different mass spec machines.| Try ESI |
 |
|---|
| ChTry ESI |
 |
|---|
| ArgC ESI |
 |
|---|
| LysN ESI |
 |
|---|
| TryLysC ESI |
 |
|---|
| Try MALDI |
 |
|---|
| ChTry MALDI |
 |
|---|
| ArgC MALDI |
 |
|---|
| LysN MALDI |
 |
|---|
| TryLysC MALDI |
 |
|---|
| Try LTQ |
 |
|---|
| ChTry LTQ |
 |
|---|
| ArgC LTQ |
 |
|---|
| LysN LTQ |
 |
|---|
| TryLysC LTQ |
 |
|---|
| Try MSlow |
 |
|---|
| ChTry MSlow |
 |
|---|
| ArgC MSlow |
 |
|---|
| LysN MSlow |
 |
|---|
| TryLysC MSlow |
 |
|---|
| Try MShigh |
 |
|---|
| ChTry MShigh |
 |
|---|
| ArgC MShigh |
 |
|---|
| LysN MShigh |
 |
|---|
| TryLysC MShigh |
 |
|---|
General Statistics
Number of major isoforms |
Number of additional isoforms |
Number of all proteins |
Number of amino acids |
Min. Seq. Length |
Max. Seq. Length |
Avg. Seq. Length |
Avg. Mol. Weight |
|---|---|---|---|---|---|---|---|
0 |
931635 |
21 |
3732 |
271.3 |
30.44 |
Amino acid frequency
Ala |
Cys |
Asp |
Glu |
Phe |
Gly |
His |
Ile |
Lys |
Leu |
|---|---|---|---|---|---|---|---|---|---|
7.402 ± 0.056 | 1.03 ± 0.016 |
5.009 ± 0.034 | 6.555 ± 0.05 |
4.158 ± 0.031 | 6.462 ± 0.051 |
1.732 ± 0.025 | 7.295 ± 0.041 |
5.271 ± 0.057 | 11.208 ± 0.057 |
Met |
Asn |
Gln |
Pro |
Arg |
Ser |
Thr |
Val |
Trp |
Tyr |
|---|---|---|---|---|---|---|---|---|---|
1.707 ± 0.02 | 4.72 ± 0.049 |
4.589 ± 0.036 | 5.097 ± 0.044 |
5.021 ± 0.038 | 6.489 ± 0.037 |
5.545 ± 0.069 | 5.949 ± 0.038 |
1.464 ± 0.018 | 3.298 ± 0.025 |
Most of the basic statistics you can see at this page can be downloaded from this CSV file
Proteome-pI is available under Creative Commons Attribution-NoDerivs license, for more details see here
| Reference: Kozlowski LP. Proteome-pI 2.0: Proteome Isoelectric Point Database Update. Nucleic Acids Res. 2021, doi: 10.1093/nar/gkab944 | Contact: Lukasz P. Kozlowski |
